Seminole vs Greek In Labor Force | Age 25-29
COMPARE
Seminole
Greek
In Labor Force | Age 25-29
In Labor Force | Age 25-29 Comparison
Seminole
Greeks
81.7%
IN LABOR FORCE | AGE 25-29
0.0/ 100
METRIC RATING
319th/ 347
METRIC RANK
85.5%
IN LABOR FORCE | AGE 25-29
99.6/ 100
METRIC RATING
58th/ 347
METRIC RANK
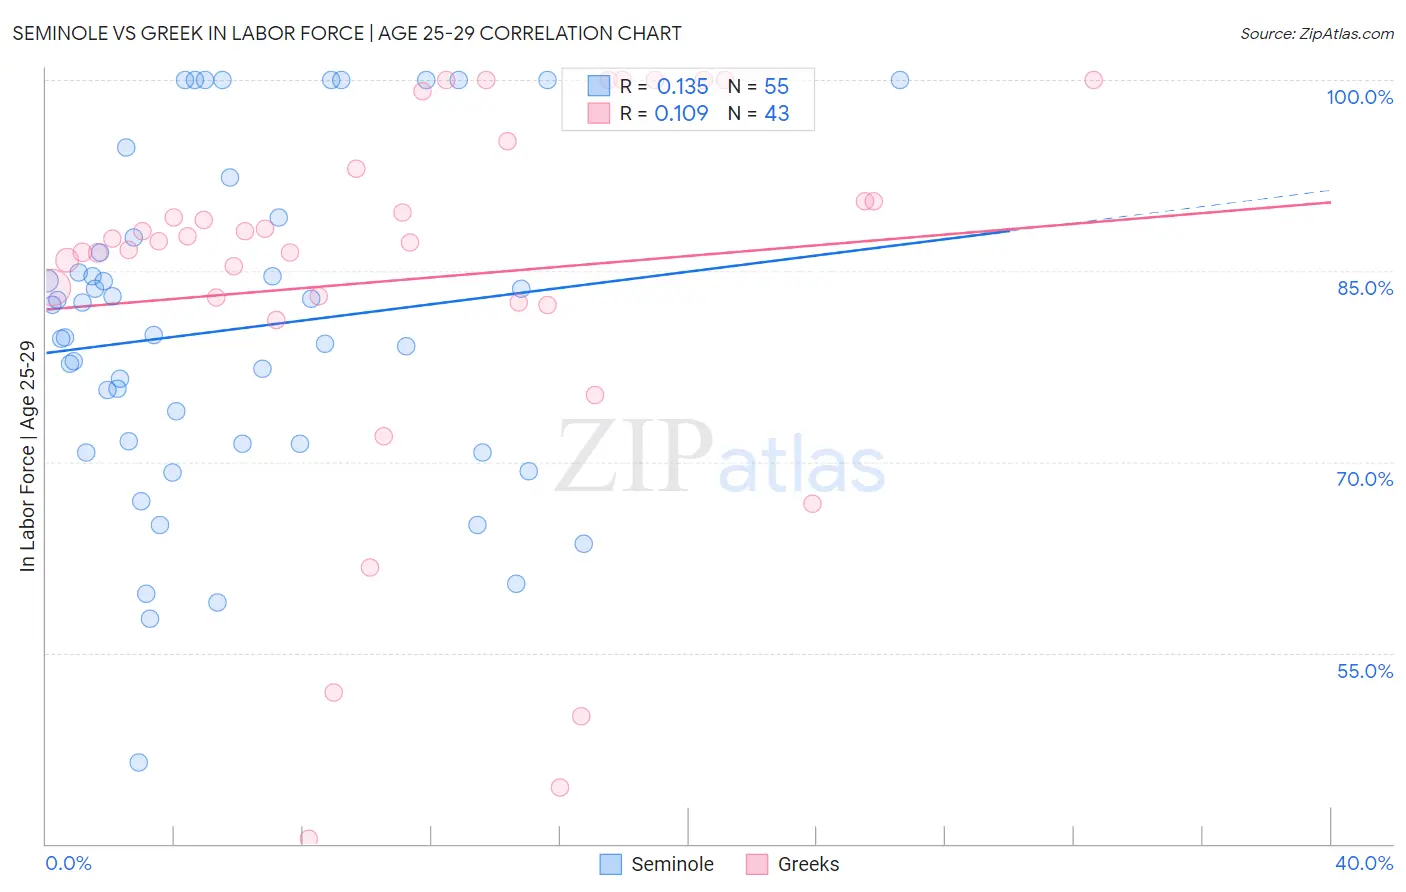
Seminole vs Greek In Labor Force | Age 25-29 Correlation Chart
The statistical analysis conducted on geographies consisting of 118,300,906 people shows a poor positive correlation between the proportion of Seminole and labor force participation rate among population between the ages 25 and 29 in the United States with a correlation coefficient (R) of 0.135 and weighted average of 81.7%. Similarly, the statistical analysis conducted on geographies consisting of 482,434,126 people shows a poor positive correlation between the proportion of Greeks and labor force participation rate among population between the ages 25 and 29 in the United States with a correlation coefficient (R) of 0.109 and weighted average of 85.5%, a difference of 4.7%.
In Labor Force | Age 25-29 Correlation Summary
| Measurement | Seminole | Greek |
| Minimum | 46.3% | 40.4% |
| Maximum | 100.0% | 100.0% |
| Range | 53.7% | 59.6% |
| Mean | 80.4% | 84.3% |
| Median | 80.0% | 87.3% |
| Interquartile 25% (IQ1) | 71.4% | 82.6% |
| Interquartile 75% (IQ3) | 87.6% | 93.1% |
| Interquartile Range (IQR) | 16.2% | 10.5% |
| Standard Deviation (Sample) | 13.0% | 15.0% |
| Standard Deviation (Population) | 12.9% | 14.8% |
Similar Demographics by In Labor Force | Age 25-29
Demographics Similar to Seminole by In Labor Force | Age 25-29
In terms of in labor force | age 25-29, the demographic groups most similar to Seminole are Colville (81.6%, a difference of 0.050%), Shoshone (81.6%, a difference of 0.11%), Kiowa (81.6%, a difference of 0.12%), Alaska Native (81.6%, a difference of 0.16%), and Comanche (81.9%, a difference of 0.22%).
| Demographics | Rating | Rank | In Labor Force | Age 25-29 |
| Hispanics or Latinos | 0.0 /100 | #312 | Tragic 82.2% |
| Yaqui | 0.0 /100 | #313 | Tragic 82.2% |
| Cherokee | 0.0 /100 | #314 | Tragic 82.1% |
| Immigrants | Mexico | 0.0 /100 | #315 | Tragic 82.0% |
| Mexicans | 0.0 /100 | #316 | Tragic 81.9% |
| Chickasaw | 0.0 /100 | #317 | Tragic 81.9% |
| Comanche | 0.0 /100 | #318 | Tragic 81.9% |
| Seminole | 0.0 /100 | #319 | Tragic 81.7% |
| Colville | 0.0 /100 | #320 | Tragic 81.6% |
| Shoshone | 0.0 /100 | #321 | Tragic 81.6% |
| Kiowa | 0.0 /100 | #322 | Tragic 81.6% |
| Alaska Natives | 0.0 /100 | #323 | Tragic 81.6% |
| Houma | 0.0 /100 | #324 | Tragic 81.2% |
| Dutch West Indians | 0.0 /100 | #325 | Tragic 81.1% |
| Choctaw | 0.0 /100 | #326 | Tragic 81.0% |
Demographics Similar to Greeks by In Labor Force | Age 25-29
In terms of in labor force | age 25-29, the demographic groups most similar to Greeks are Eastern European (85.5%, a difference of 0.010%), Estonian (85.5%, a difference of 0.010%), Immigrants from Morocco (85.5%, a difference of 0.010%), Thai (85.5%, a difference of 0.040%), and Serbian (85.5%, a difference of 0.040%).
| Demographics | Rating | Rank | In Labor Force | Age 25-29 |
| Immigrants | Latvia | 99.8 /100 | #51 | Exceptional 85.6% |
| Immigrants | Poland | 99.7 /100 | #52 | Exceptional 85.6% |
| Belgians | 99.7 /100 | #53 | Exceptional 85.5% |
| Albanians | 99.7 /100 | #54 | Exceptional 85.5% |
| Immigrants | Brazil | 99.7 /100 | #55 | Exceptional 85.5% |
| Eastern Europeans | 99.6 /100 | #56 | Exceptional 85.5% |
| Estonians | 99.6 /100 | #57 | Exceptional 85.5% |
| Greeks | 99.6 /100 | #58 | Exceptional 85.5% |
| Immigrants | Morocco | 99.5 /100 | #59 | Exceptional 85.5% |
| Thais | 99.5 /100 | #60 | Exceptional 85.5% |
| Serbians | 99.5 /100 | #61 | Exceptional 85.5% |
| Taiwanese | 99.4 /100 | #62 | Exceptional 85.4% |
| Immigrants | Kenya | 99.4 /100 | #63 | Exceptional 85.4% |
| Immigrants | Italy | 99.3 /100 | #64 | Exceptional 85.4% |
| Immigrants | Czechoslovakia | 99.3 /100 | #65 | Exceptional 85.4% |