Liberian vs Greek In Labor Force | Age 25-29
COMPARE
Liberian
Greek
In Labor Force | Age 25-29
In Labor Force | Age 25-29 Comparison
Liberians
Greeks
86.1%
IN LABOR FORCE | AGE 25-29
100.0/ 100
METRIC RATING
10th/ 347
METRIC RANK
85.5%
IN LABOR FORCE | AGE 25-29
99.6/ 100
METRIC RATING
58th/ 347
METRIC RANK
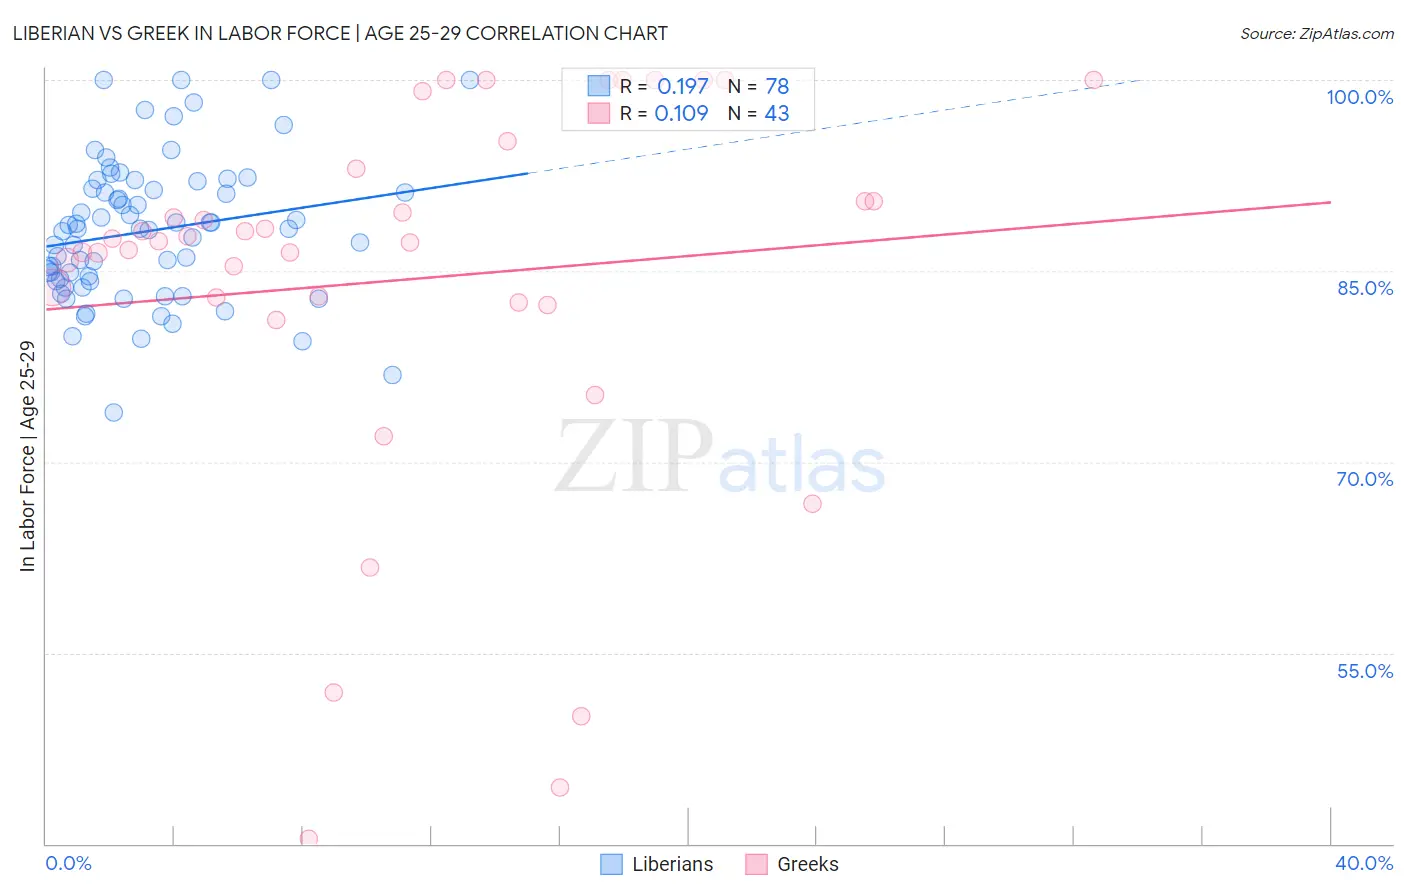
Liberian vs Greek In Labor Force | Age 25-29 Correlation Chart
The statistical analysis conducted on geographies consisting of 118,077,550 people shows a poor positive correlation between the proportion of Liberians and labor force participation rate among population between the ages 25 and 29 in the United States with a correlation coefficient (R) of 0.197 and weighted average of 86.1%. Similarly, the statistical analysis conducted on geographies consisting of 482,434,126 people shows a poor positive correlation between the proportion of Greeks and labor force participation rate among population between the ages 25 and 29 in the United States with a correlation coefficient (R) of 0.109 and weighted average of 85.5%, a difference of 0.75%.
In Labor Force | Age 25-29 Correlation Summary
| Measurement | Liberian | Greek |
| Minimum | 73.9% | 40.4% |
| Maximum | 100.0% | 100.0% |
| Range | 26.1% | 59.6% |
| Mean | 88.1% | 84.3% |
| Median | 88.3% | 87.3% |
| Interquartile 25% (IQ1) | 84.2% | 82.6% |
| Interquartile 75% (IQ3) | 91.5% | 93.1% |
| Interquartile Range (IQR) | 7.3% | 10.5% |
| Standard Deviation (Sample) | 5.5% | 15.0% |
| Standard Deviation (Population) | 5.5% | 14.8% |
Similar Demographics by In Labor Force | Age 25-29
Demographics Similar to Liberians by In Labor Force | Age 25-29
In terms of in labor force | age 25-29, the demographic groups most similar to Liberians are Immigrants from Ethiopia (86.1%, a difference of 0.0%), Immigrants from Lithuania (86.1%, a difference of 0.010%), Norwegian (86.1%, a difference of 0.030%), Ethiopian (86.2%, a difference of 0.050%), and Latvian (86.1%, a difference of 0.060%).
| Demographics | Rating | Rank | In Labor Force | Age 25-29 |
| Somalis | 100.0 /100 | #3 | Exceptional 87.1% |
| Carpatho Rusyns | 100.0 /100 | #4 | Exceptional 87.0% |
| Luxembourgers | 100.0 /100 | #5 | Exceptional 86.9% |
| Slovenes | 100.0 /100 | #6 | Exceptional 86.4% |
| Immigrants | Bosnia and Herzegovina | 100.0 /100 | #7 | Exceptional 86.3% |
| Immigrants | Cabo Verde | 100.0 /100 | #8 | Exceptional 86.2% |
| Ethiopians | 100.0 /100 | #9 | Exceptional 86.2% |
| Liberians | 100.0 /100 | #10 | Exceptional 86.1% |
| Immigrants | Ethiopia | 100.0 /100 | #11 | Exceptional 86.1% |
| Immigrants | Lithuania | 100.0 /100 | #12 | Exceptional 86.1% |
| Norwegians | 100.0 /100 | #13 | Exceptional 86.1% |
| Latvians | 100.0 /100 | #14 | Exceptional 86.1% |
| Bolivians | 100.0 /100 | #15 | Exceptional 86.1% |
| Immigrants | Bolivia | 100.0 /100 | #16 | Exceptional 86.1% |
| Bermudans | 100.0 /100 | #17 | Exceptional 86.0% |
Demographics Similar to Greeks by In Labor Force | Age 25-29
In terms of in labor force | age 25-29, the demographic groups most similar to Greeks are Eastern European (85.5%, a difference of 0.010%), Estonian (85.5%, a difference of 0.010%), Immigrants from Morocco (85.5%, a difference of 0.010%), Thai (85.5%, a difference of 0.040%), and Serbian (85.5%, a difference of 0.040%).
| Demographics | Rating | Rank | In Labor Force | Age 25-29 |
| Immigrants | Latvia | 99.8 /100 | #51 | Exceptional 85.6% |
| Immigrants | Poland | 99.7 /100 | #52 | Exceptional 85.6% |
| Belgians | 99.7 /100 | #53 | Exceptional 85.5% |
| Albanians | 99.7 /100 | #54 | Exceptional 85.5% |
| Immigrants | Brazil | 99.7 /100 | #55 | Exceptional 85.5% |
| Eastern Europeans | 99.6 /100 | #56 | Exceptional 85.5% |
| Estonians | 99.6 /100 | #57 | Exceptional 85.5% |
| Greeks | 99.6 /100 | #58 | Exceptional 85.5% |
| Immigrants | Morocco | 99.5 /100 | #59 | Exceptional 85.5% |
| Thais | 99.5 /100 | #60 | Exceptional 85.5% |
| Serbians | 99.5 /100 | #61 | Exceptional 85.5% |
| Taiwanese | 99.4 /100 | #62 | Exceptional 85.4% |
| Immigrants | Kenya | 99.4 /100 | #63 | Exceptional 85.4% |
| Immigrants | Italy | 99.3 /100 | #64 | Exceptional 85.4% |
| Immigrants | Czechoslovakia | 99.3 /100 | #65 | Exceptional 85.4% |