Samoan vs Bhutanese In Labor Force | Age 45-54
COMPARE
Samoan
Bhutanese
In Labor Force | Age 45-54
In Labor Force | Age 45-54 Comparison
Samoans
Bhutanese
81.8%
IN LABOR FORCE | AGE 45-54
0.6/ 100
METRIC RATING
243rd/ 347
METRIC RANK
83.5%
IN LABOR FORCE | AGE 45-54
98.3/ 100
METRIC RATING
59th/ 347
METRIC RANK
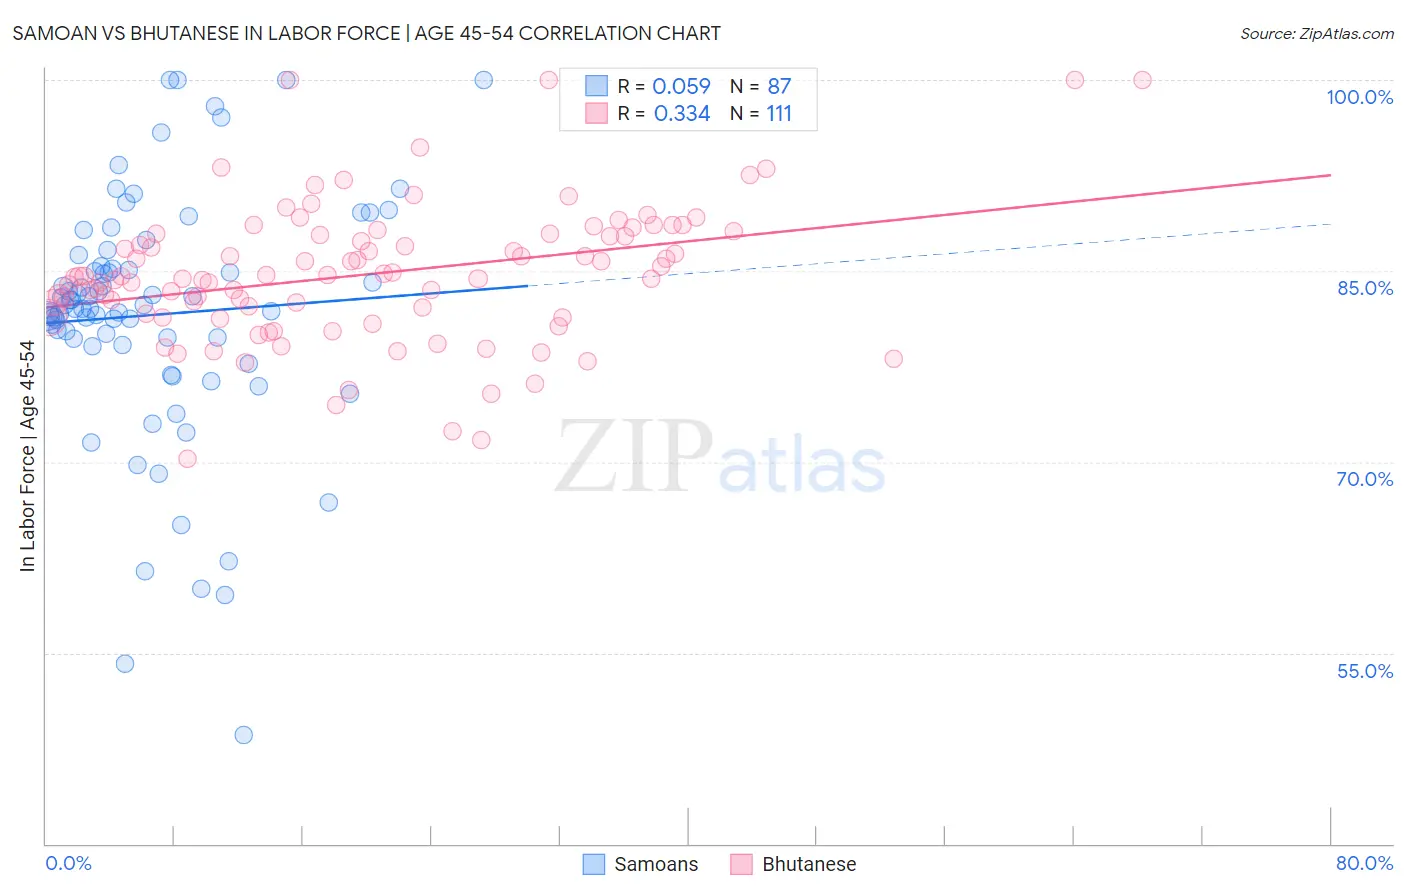
Samoan vs Bhutanese In Labor Force | Age 45-54 Correlation Chart
The statistical analysis conducted on geographies consisting of 225,090,886 people shows a slight positive correlation between the proportion of Samoans and labor force participation rate among population between the ages 45 and 54 in the United States with a correlation coefficient (R) of 0.059 and weighted average of 81.8%. Similarly, the statistical analysis conducted on geographies consisting of 455,122,141 people shows a mild positive correlation between the proportion of Bhutanese and labor force participation rate among population between the ages 45 and 54 in the United States with a correlation coefficient (R) of 0.334 and weighted average of 83.5%, a difference of 2.0%.
In Labor Force | Age 45-54 Correlation Summary
| Measurement | Samoan | Bhutanese |
| Minimum | 48.5% | 70.2% |
| Maximum | 100.0% | 100.0% |
| Range | 51.5% | 29.8% |
| Mean | 81.6% | 84.8% |
| Median | 82.1% | 84.6% |
| Interquartile 25% (IQ1) | 79.2% | 81.3% |
| Interquartile 75% (IQ3) | 85.4% | 87.9% |
| Interquartile Range (IQR) | 6.1% | 6.6% |
| Standard Deviation (Sample) | 9.7% | 5.5% |
| Standard Deviation (Population) | 9.6% | 5.4% |
Similar Demographics by In Labor Force | Age 45-54
Demographics Similar to Samoans by In Labor Force | Age 45-54
In terms of in labor force | age 45-54, the demographic groups most similar to Samoans are White/Caucasian (81.9%, a difference of 0.010%), Immigrants from Cambodia (81.9%, a difference of 0.050%), Immigrants from El Salvador (81.9%, a difference of 0.090%), Celtic (81.8%, a difference of 0.090%), and Immigrants from Thailand (81.9%, a difference of 0.10%).
| Demographics | Rating | Rank | In Labor Force | Age 45-54 |
| Basques | 1.2 /100 | #236 | Tragic 82.0% |
| Immigrants | Trinidad and Tobago | 1.2 /100 | #237 | Tragic 82.0% |
| Trinidadians and Tobagonians | 1.1 /100 | #238 | Tragic 81.9% |
| Immigrants | Thailand | 1.0 /100 | #239 | Tragic 81.9% |
| Immigrants | El Salvador | 1.0 /100 | #240 | Tragic 81.9% |
| Immigrants | Cambodia | 0.8 /100 | #241 | Tragic 81.9% |
| Whites/Caucasians | 0.7 /100 | #242 | Tragic 81.9% |
| Samoans | 0.6 /100 | #243 | Tragic 81.8% |
| Celtics | 0.4 /100 | #244 | Tragic 81.8% |
| Alaska Natives | 0.4 /100 | #245 | Tragic 81.8% |
| Alaskan Athabascans | 0.4 /100 | #246 | Tragic 81.8% |
| Central Americans | 0.4 /100 | #247 | Tragic 81.7% |
| Puget Sound Salish | 0.3 /100 | #248 | Tragic 81.7% |
| Hmong | 0.3 /100 | #249 | Tragic 81.7% |
| Immigrants | Armenia | 0.2 /100 | #250 | Tragic 81.7% |
Demographics Similar to Bhutanese by In Labor Force | Age 45-54
In terms of in labor force | age 45-54, the demographic groups most similar to Bhutanese are Carpatho Rusyn (83.5%, a difference of 0.0%), Filipino (83.5%, a difference of 0.010%), Eastern European (83.5%, a difference of 0.020%), Immigrants from Peru (83.5%, a difference of 0.030%), and Paraguayan (83.5%, a difference of 0.030%).
| Demographics | Rating | Rank | In Labor Force | Age 45-54 |
| Poles | 98.7 /100 | #52 | Exceptional 83.6% |
| Peruvians | 98.7 /100 | #53 | Exceptional 83.6% |
| Somalis | 98.7 /100 | #54 | Exceptional 83.5% |
| Macedonians | 98.7 /100 | #55 | Exceptional 83.5% |
| Immigrants | Peru | 98.6 /100 | #56 | Exceptional 83.5% |
| Paraguayans | 98.5 /100 | #57 | Exceptional 83.5% |
| Eastern Europeans | 98.5 /100 | #58 | Exceptional 83.5% |
| Bhutanese | 98.3 /100 | #59 | Exceptional 83.5% |
| Carpatho Rusyns | 98.3 /100 | #60 | Exceptional 83.5% |
| Filipinos | 98.3 /100 | #61 | Exceptional 83.5% |
| Immigrants | Taiwan | 98.0 /100 | #62 | Exceptional 83.5% |
| Afghans | 97.9 /100 | #63 | Exceptional 83.5% |
| Immigrants | Kenya | 97.9 /100 | #64 | Exceptional 83.5% |
| Egyptians | 97.9 /100 | #65 | Exceptional 83.5% |
| Asians | 97.7 /100 | #66 | Exceptional 83.4% |