Alsatian vs Bhutanese In Labor Force | Age 45-54
COMPARE
Alsatian
Bhutanese
In Labor Force | Age 45-54
In Labor Force | Age 45-54 Comparison
Alsatians
Bhutanese
81.3%
IN LABOR FORCE | AGE 45-54
0.0/ 100
METRIC RATING
269th/ 347
METRIC RANK
83.5%
IN LABOR FORCE | AGE 45-54
98.3/ 100
METRIC RATING
59th/ 347
METRIC RANK
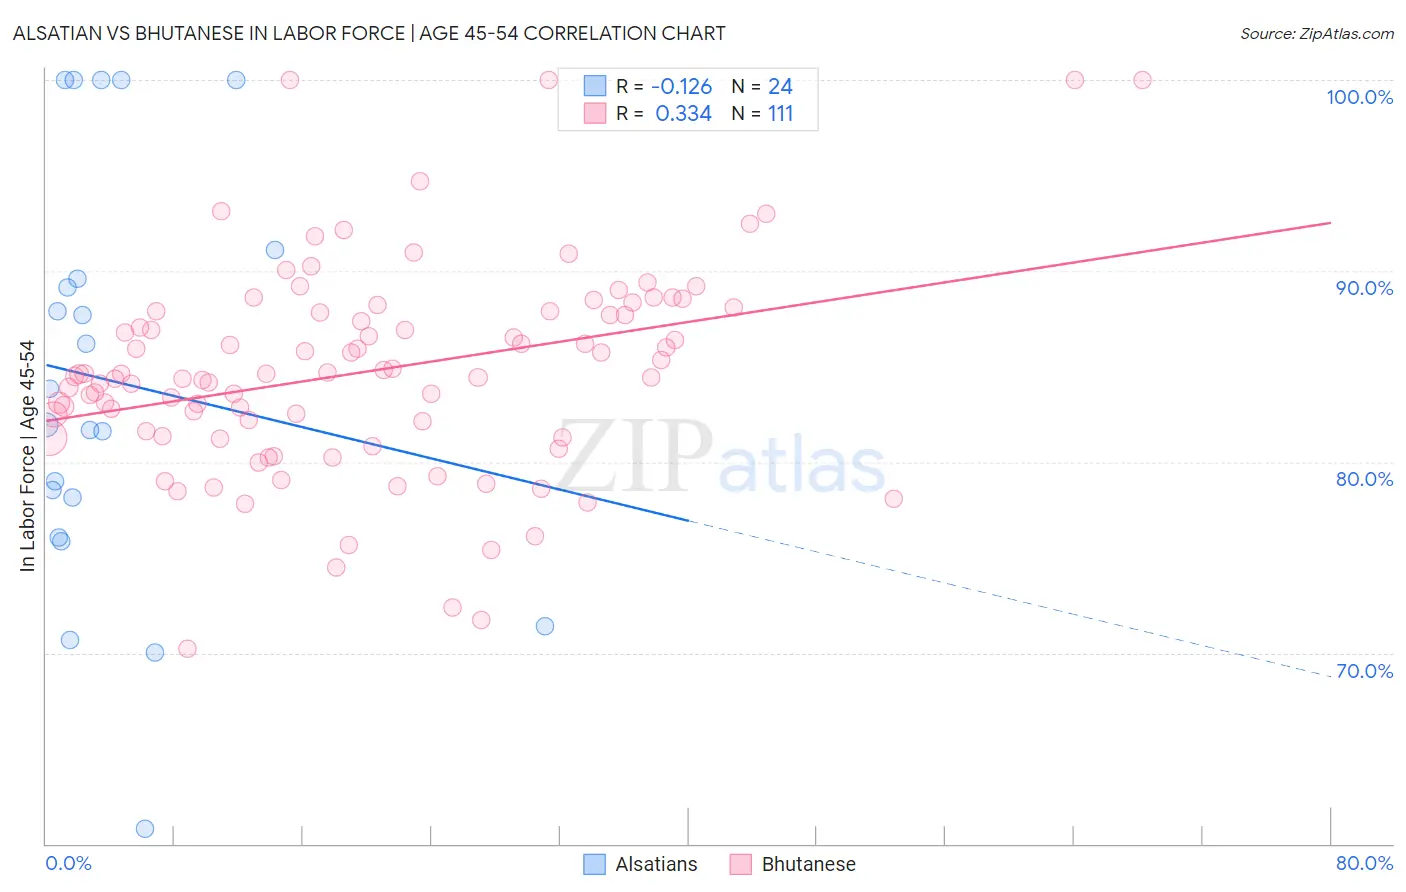
Alsatian vs Bhutanese In Labor Force | Age 45-54 Correlation Chart
The statistical analysis conducted on geographies consisting of 82,679,176 people shows a poor negative correlation between the proportion of Alsatians and labor force participation rate among population between the ages 45 and 54 in the United States with a correlation coefficient (R) of -0.126 and weighted average of 81.3%. Similarly, the statistical analysis conducted on geographies consisting of 455,122,141 people shows a mild positive correlation between the proportion of Bhutanese and labor force participation rate among population between the ages 45 and 54 in the United States with a correlation coefficient (R) of 0.334 and weighted average of 83.5%, a difference of 2.6%.
In Labor Force | Age 45-54 Correlation Summary
| Measurement | Alsatian | Bhutanese |
| Minimum | 60.8% | 70.2% |
| Maximum | 100.0% | 100.0% |
| Range | 39.2% | 29.8% |
| Mean | 84.2% | 84.8% |
| Median | 82.9% | 84.6% |
| Interquartile 25% (IQ1) | 77.1% | 81.3% |
| Interquartile 75% (IQ3) | 90.3% | 87.9% |
| Interquartile Range (IQR) | 13.2% | 6.6% |
| Standard Deviation (Sample) | 10.9% | 5.5% |
| Standard Deviation (Population) | 10.7% | 5.4% |
Similar Demographics by In Labor Force | Age 45-54
Demographics Similar to Alsatians by In Labor Force | Age 45-54
In terms of in labor force | age 45-54, the demographic groups most similar to Alsatians are Immigrants from Honduras (81.4%, a difference of 0.020%), Bangladeshi (81.3%, a difference of 0.030%), West Indian (81.4%, a difference of 0.040%), Immigrants from Barbados (81.3%, a difference of 0.040%), and Spanish (81.3%, a difference of 0.040%).
| Demographics | Rating | Rank | In Labor Force | Age 45-54 |
| Immigrants | Guyana | 0.1 /100 | #262 | Tragic 81.5% |
| Indonesians | 0.1 /100 | #263 | Tragic 81.5% |
| Immigrants | West Indies | 0.1 /100 | #264 | Tragic 81.5% |
| Hondurans | 0.1 /100 | #265 | Tragic 81.4% |
| Immigrants | St. Vincent and the Grenadines | 0.1 /100 | #266 | Tragic 81.4% |
| West Indians | 0.1 /100 | #267 | Tragic 81.4% |
| Immigrants | Honduras | 0.0 /100 | #268 | Tragic 81.4% |
| Alsatians | 0.0 /100 | #269 | Tragic 81.3% |
| Bangladeshis | 0.0 /100 | #270 | Tragic 81.3% |
| Immigrants | Barbados | 0.0 /100 | #271 | Tragic 81.3% |
| Spanish | 0.0 /100 | #272 | Tragic 81.3% |
| Chippewa | 0.0 /100 | #273 | Tragic 81.3% |
| British West Indians | 0.0 /100 | #274 | Tragic 81.2% |
| Immigrants | Nonimmigrants | 0.0 /100 | #275 | Tragic 81.2% |
| U.S. Virgin Islanders | 0.0 /100 | #276 | Tragic 81.2% |
Demographics Similar to Bhutanese by In Labor Force | Age 45-54
In terms of in labor force | age 45-54, the demographic groups most similar to Bhutanese are Carpatho Rusyn (83.5%, a difference of 0.0%), Filipino (83.5%, a difference of 0.010%), Eastern European (83.5%, a difference of 0.020%), Immigrants from Peru (83.5%, a difference of 0.030%), and Paraguayan (83.5%, a difference of 0.030%).
| Demographics | Rating | Rank | In Labor Force | Age 45-54 |
| Poles | 98.7 /100 | #52 | Exceptional 83.6% |
| Peruvians | 98.7 /100 | #53 | Exceptional 83.6% |
| Somalis | 98.7 /100 | #54 | Exceptional 83.5% |
| Macedonians | 98.7 /100 | #55 | Exceptional 83.5% |
| Immigrants | Peru | 98.6 /100 | #56 | Exceptional 83.5% |
| Paraguayans | 98.5 /100 | #57 | Exceptional 83.5% |
| Eastern Europeans | 98.5 /100 | #58 | Exceptional 83.5% |
| Bhutanese | 98.3 /100 | #59 | Exceptional 83.5% |
| Carpatho Rusyns | 98.3 /100 | #60 | Exceptional 83.5% |
| Filipinos | 98.3 /100 | #61 | Exceptional 83.5% |
| Immigrants | Taiwan | 98.0 /100 | #62 | Exceptional 83.5% |
| Afghans | 97.9 /100 | #63 | Exceptional 83.5% |
| Immigrants | Kenya | 97.9 /100 | #64 | Exceptional 83.5% |
| Egyptians | 97.9 /100 | #65 | Exceptional 83.5% |
| Asians | 97.7 /100 | #66 | Exceptional 83.4% |