Samoan vs Immigrants from Philippines In Labor Force | Age 45-54
COMPARE
Samoan
Immigrants from Philippines
In Labor Force | Age 45-54
In Labor Force | Age 45-54 Comparison
Samoans
Immigrants from Philippines
81.8%
IN LABOR FORCE | AGE 45-54
0.6/ 100
METRIC RATING
243rd/ 347
METRIC RANK
82.9%
IN LABOR FORCE | AGE 45-54
69.0/ 100
METRIC RATING
155th/ 347
METRIC RANK
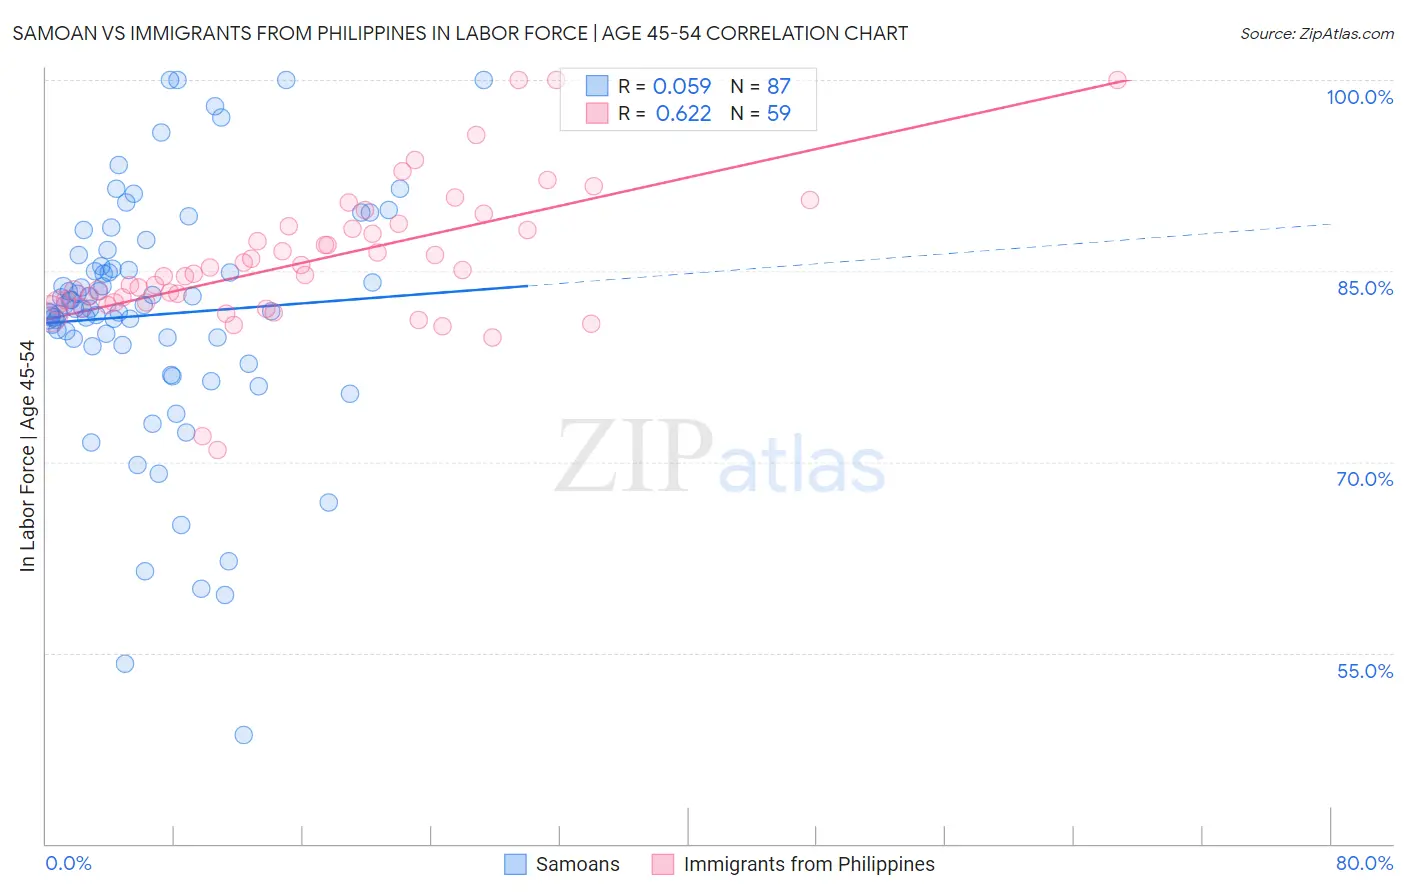
Samoan vs Immigrants from Philippines In Labor Force | Age 45-54 Correlation Chart
The statistical analysis conducted on geographies consisting of 225,090,886 people shows a slight positive correlation between the proportion of Samoans and labor force participation rate among population between the ages 45 and 54 in the United States with a correlation coefficient (R) of 0.059 and weighted average of 81.8%. Similarly, the statistical analysis conducted on geographies consisting of 471,007,870 people shows a significant positive correlation between the proportion of Immigrants from Philippines and labor force participation rate among population between the ages 45 and 54 in the United States with a correlation coefficient (R) of 0.622 and weighted average of 82.9%, a difference of 1.3%.
In Labor Force | Age 45-54 Correlation Summary
| Measurement | Samoan | Immigrants from Philippines |
| Minimum | 48.5% | 70.9% |
| Maximum | 100.0% | 100.0% |
| Range | 51.5% | 29.1% |
| Mean | 81.6% | 85.8% |
| Median | 82.1% | 84.7% |
| Interquartile 25% (IQ1) | 79.2% | 82.5% |
| Interquartile 75% (IQ3) | 85.4% | 88.6% |
| Interquartile Range (IQR) | 6.1% | 6.0% |
| Standard Deviation (Sample) | 9.7% | 5.5% |
| Standard Deviation (Population) | 9.6% | 5.5% |
Similar Demographics by In Labor Force | Age 45-54
Demographics Similar to Samoans by In Labor Force | Age 45-54
In terms of in labor force | age 45-54, the demographic groups most similar to Samoans are White/Caucasian (81.9%, a difference of 0.010%), Immigrants from Cambodia (81.9%, a difference of 0.050%), Immigrants from El Salvador (81.9%, a difference of 0.090%), Celtic (81.8%, a difference of 0.090%), and Immigrants from Thailand (81.9%, a difference of 0.10%).
| Demographics | Rating | Rank | In Labor Force | Age 45-54 |
| Basques | 1.2 /100 | #236 | Tragic 82.0% |
| Immigrants | Trinidad and Tobago | 1.2 /100 | #237 | Tragic 82.0% |
| Trinidadians and Tobagonians | 1.1 /100 | #238 | Tragic 81.9% |
| Immigrants | Thailand | 1.0 /100 | #239 | Tragic 81.9% |
| Immigrants | El Salvador | 1.0 /100 | #240 | Tragic 81.9% |
| Immigrants | Cambodia | 0.8 /100 | #241 | Tragic 81.9% |
| Whites/Caucasians | 0.7 /100 | #242 | Tragic 81.9% |
| Samoans | 0.6 /100 | #243 | Tragic 81.8% |
| Celtics | 0.4 /100 | #244 | Tragic 81.8% |
| Alaska Natives | 0.4 /100 | #245 | Tragic 81.8% |
| Alaskan Athabascans | 0.4 /100 | #246 | Tragic 81.8% |
| Central Americans | 0.4 /100 | #247 | Tragic 81.7% |
| Puget Sound Salish | 0.3 /100 | #248 | Tragic 81.7% |
| Hmong | 0.3 /100 | #249 | Tragic 81.7% |
| Immigrants | Armenia | 0.2 /100 | #250 | Tragic 81.7% |
Demographics Similar to Immigrants from Philippines by In Labor Force | Age 45-54
In terms of in labor force | age 45-54, the demographic groups most similar to Immigrants from Philippines are Immigrants from Saudi Arabia (82.9%, a difference of 0.0%), Immigrants from Ghana (82.9%, a difference of 0.010%), Immigrants from Australia (82.9%, a difference of 0.010%), Immigrants from Southern Europe (82.9%, a difference of 0.010%), and Immigrants from Indonesia (82.9%, a difference of 0.020%).
| Demographics | Rating | Rank | In Labor Force | Age 45-54 |
| Immigrants | Nigeria | 74.1 /100 | #148 | Good 83.0% |
| Immigrants | Sweden | 73.3 /100 | #149 | Good 82.9% |
| Immigrants | Netherlands | 72.6 /100 | #150 | Good 82.9% |
| Koreans | 71.9 /100 | #151 | Good 82.9% |
| Slavs | 71.5 /100 | #152 | Good 82.9% |
| Immigrants | Indonesia | 70.6 /100 | #153 | Good 82.9% |
| Immigrants | Ghana | 70.3 /100 | #154 | Good 82.9% |
| Immigrants | Philippines | 69.0 /100 | #155 | Good 82.9% |
| Immigrants | Saudi Arabia | 68.8 /100 | #156 | Good 82.9% |
| Immigrants | Australia | 68.2 /100 | #157 | Good 82.9% |
| Immigrants | Southern Europe | 67.8 /100 | #158 | Good 82.9% |
| Immigrants | Austria | 64.6 /100 | #159 | Good 82.9% |
| Laotians | 62.8 /100 | #160 | Good 82.9% |
| South American Indians | 62.2 /100 | #161 | Good 82.9% |
| Haitians | 61.8 /100 | #162 | Good 82.8% |