Immigrants from Zaire vs Bhutanese In Labor Force | Age 45-54
COMPARE
Immigrants from Zaire
Bhutanese
In Labor Force | Age 45-54
In Labor Force | Age 45-54 Comparison
Immigrants from Zaire
Bhutanese
82.8%
IN LABOR FORCE | AGE 45-54
52.9/ 100
METRIC RATING
171st/ 347
METRIC RANK
83.5%
IN LABOR FORCE | AGE 45-54
98.3/ 100
METRIC RATING
59th/ 347
METRIC RANK
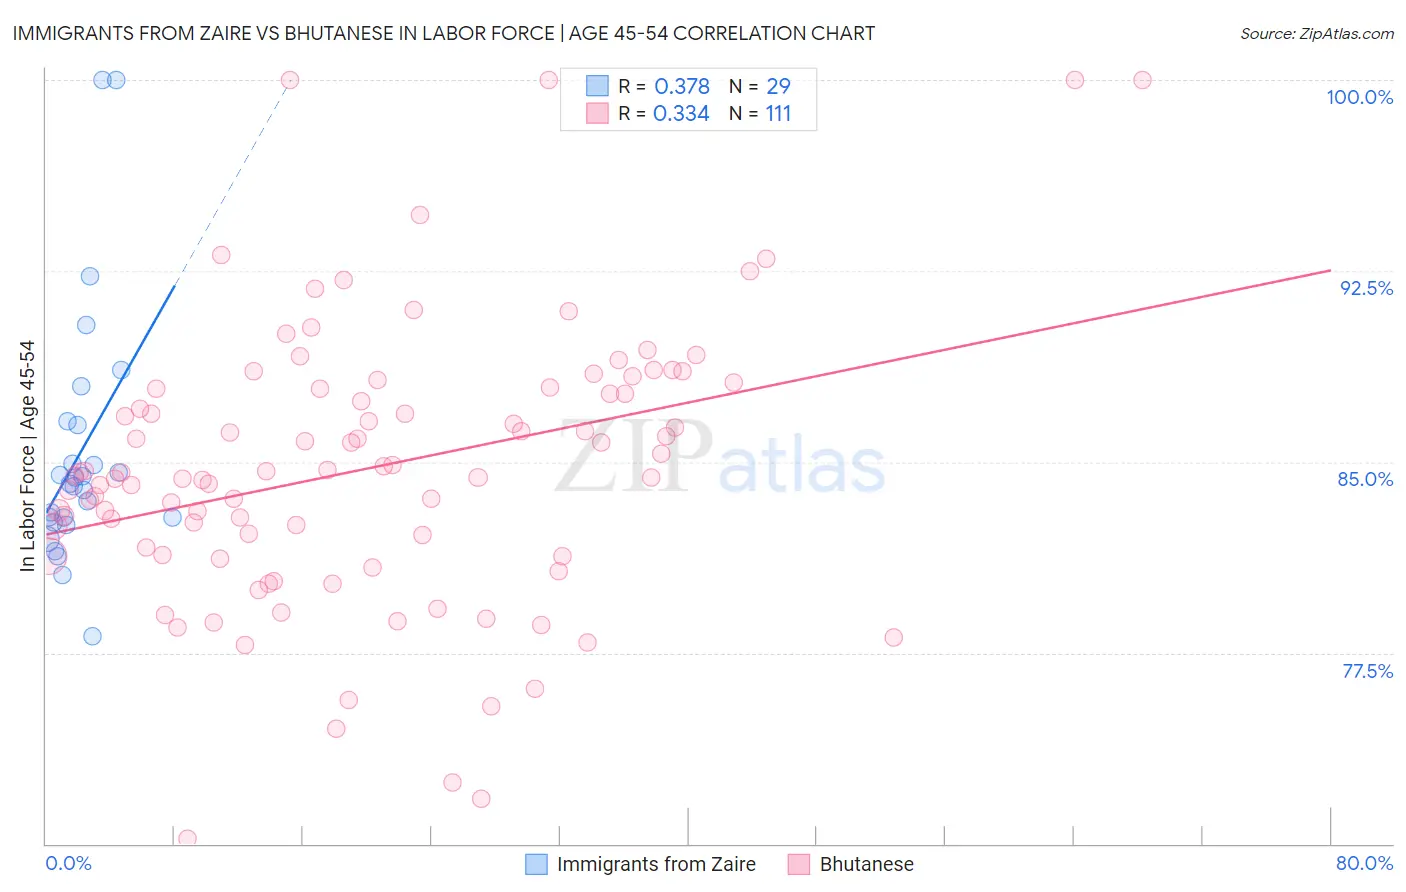
Immigrants from Zaire vs Bhutanese In Labor Force | Age 45-54 Correlation Chart
The statistical analysis conducted on geographies consisting of 107,243,471 people shows a mild positive correlation between the proportion of Immigrants from Zaire and labor force participation rate among population between the ages 45 and 54 in the United States with a correlation coefficient (R) of 0.378 and weighted average of 82.8%. Similarly, the statistical analysis conducted on geographies consisting of 455,122,141 people shows a mild positive correlation between the proportion of Bhutanese and labor force participation rate among population between the ages 45 and 54 in the United States with a correlation coefficient (R) of 0.334 and weighted average of 83.5%, a difference of 0.87%.
In Labor Force | Age 45-54 Correlation Summary
| Measurement | Immigrants from Zaire | Bhutanese |
| Minimum | 78.2% | 70.2% |
| Maximum | 100.0% | 100.0% |
| Range | 21.8% | 29.8% |
| Mean | 85.4% | 84.8% |
| Median | 84.1% | 84.6% |
| Interquartile 25% (IQ1) | 82.7% | 81.3% |
| Interquartile 75% (IQ3) | 86.5% | 87.9% |
| Interquartile Range (IQR) | 3.8% | 6.6% |
| Standard Deviation (Sample) | 5.0% | 5.5% |
| Standard Deviation (Population) | 4.9% | 5.4% |
Similar Demographics by In Labor Force | Age 45-54
Demographics Similar to Immigrants from Zaire by In Labor Force | Age 45-54
In terms of in labor force | age 45-54, the demographic groups most similar to Immigrants from Zaire are Pakistani (82.8%, a difference of 0.0%), Immigrants from Western Africa (82.8%, a difference of 0.010%), Icelander (82.8%, a difference of 0.010%), Nicaraguan (82.8%, a difference of 0.020%), and Swiss (82.8%, a difference of 0.030%).
| Demographics | Rating | Rank | In Labor Force | Age 45-54 |
| German Russians | 61.3 /100 | #164 | Good 82.8% |
| Immigrants | Sudan | 59.9 /100 | #165 | Average 82.8% |
| Immigrants | South Eastern Asia | 57.4 /100 | #166 | Average 82.8% |
| Swiss | 56.5 /100 | #167 | Average 82.8% |
| Immigrants | South Africa | 55.8 /100 | #168 | Average 82.8% |
| Immigrants | Western Africa | 54.1 /100 | #169 | Average 82.8% |
| Pakistanis | 53.2 /100 | #170 | Average 82.8% |
| Immigrants | Zaire | 52.9 /100 | #171 | Average 82.8% |
| Icelanders | 51.8 /100 | #172 | Average 82.8% |
| Nicaraguans | 50.3 /100 | #173 | Average 82.8% |
| Costa Ricans | 50.0 /100 | #174 | Average 82.8% |
| Immigrants | Liberia | 47.9 /100 | #175 | Average 82.7% |
| Northern Europeans | 46.9 /100 | #176 | Average 82.7% |
| Immigrants | Nicaragua | 44.6 /100 | #177 | Average 82.7% |
| Nigerians | 40.5 /100 | #178 | Average 82.7% |
Demographics Similar to Bhutanese by In Labor Force | Age 45-54
In terms of in labor force | age 45-54, the demographic groups most similar to Bhutanese are Carpatho Rusyn (83.5%, a difference of 0.0%), Filipino (83.5%, a difference of 0.010%), Eastern European (83.5%, a difference of 0.020%), Immigrants from Peru (83.5%, a difference of 0.030%), and Paraguayan (83.5%, a difference of 0.030%).
| Demographics | Rating | Rank | In Labor Force | Age 45-54 |
| Poles | 98.7 /100 | #52 | Exceptional 83.6% |
| Peruvians | 98.7 /100 | #53 | Exceptional 83.6% |
| Somalis | 98.7 /100 | #54 | Exceptional 83.5% |
| Macedonians | 98.7 /100 | #55 | Exceptional 83.5% |
| Immigrants | Peru | 98.6 /100 | #56 | Exceptional 83.5% |
| Paraguayans | 98.5 /100 | #57 | Exceptional 83.5% |
| Eastern Europeans | 98.5 /100 | #58 | Exceptional 83.5% |
| Bhutanese | 98.3 /100 | #59 | Exceptional 83.5% |
| Carpatho Rusyns | 98.3 /100 | #60 | Exceptional 83.5% |
| Filipinos | 98.3 /100 | #61 | Exceptional 83.5% |
| Immigrants | Taiwan | 98.0 /100 | #62 | Exceptional 83.5% |
| Afghans | 97.9 /100 | #63 | Exceptional 83.5% |
| Immigrants | Kenya | 97.9 /100 | #64 | Exceptional 83.5% |
| Egyptians | 97.9 /100 | #65 | Exceptional 83.5% |
| Asians | 97.7 /100 | #66 | Exceptional 83.4% |