Immigrants from Ireland vs Immigrants from Zimbabwe In Labor Force | Age 45-54

COMPARE

Immigrants from Ireland
Race
Ancestry
AfghanAfricanAlaska NativeAlaskan AthabascanAlbanianAleutAlsatianAmericanApacheArabArapahoArgentineanArmenianAssyrian/Chaldean/SyriacAustralianAustrianBahamianBangladeshiBarbadianBasqueBelgianBelizeanBermudanBhutaneseBlackfeetBolivianBrazilianBritishBritish West IndianBulgarianBurmeseCajunCambodianCanadianCape VerdeanCarpatho RusynCelticCentral AmericanCentral American IndianCherokeeCheyenneChickasawChileanChineseChippewaChoctawColombianColvilleComancheCosta RicanCreeCreekCroatianCrowCubanCypriotCzechCzechoslovakianDanishDelawareDominicanDutchDutch West IndianEastern EuropeanEcuadorianEgyptianEnglishEstonianEthiopianEuropeanFijianFilipinoFinnishFrenchFrench American IndianFrench CanadianGermanGerman RussianGhanaianGreekGuamanian/ChamorroGuatemalanGuyaneseHaitianHmongHonduranHopiHoumaHungarianIcelanderIndian (Asian)IndonesianInupiatIranianIraqiIrishIroquoisIsraeliItalianJamaicanJapaneseJordanianKenyanKiowaKoreanLaotianLatvianLebaneseLiberianLithuanianLumbeeLuxembourgerMacedonianMalaysianMalteseMarshalleseMenomineeMexicanMexican American IndianMongolianMoroccanNative HawaiianNavajoNepaleseNew ZealanderNicaraguanNigerianNorthern EuropeanNorwegianOkinawanOsageOttawaPaiutePakistaniPalestinianPanamanianParaguayanPennsylvania GermanPeruvianPimaPolishPortuguesePotawatomiPuebloPuerto RicanPuget Sound SalishRomanianRussianSalvadoranSamoanScandinavianScotch-IrishScottishSeminoleSenegaleseSerbianShoshoneSierra LeoneanSiouxSlavicSlovakSloveneSomaliSouth AfricanSouth AmericanSouth American IndianSoviet UnionSpaniardSpanishSpanish AmericanSpanish American IndianSri LankanSubsaharan AfricanSudaneseSwedishSwissSyrianTaiwaneseThaiTlingit-HaidaTohono O'OdhamTonganTrinidadian and TobagonianTsimshianTurkishU.S. Virgin IslanderUgandanUkrainianUruguayanUteVenezuelanVietnameseWelshWest IndianYakamaYaquiYugoslavianYumanYup'ikZimbabwean
Immigration
NonimmigrantsImmigrantsAfghanistanAfricaAlbaniaArgentinaArmeniaAsiaAustraliaAustriaBahamasBangladeshBarbadosBelarusBelgiumBelizeBoliviaBosnia and HerzegovinaBrazilBulgariaBurma/MyanmarCabo VerdeCambodiaCameroonCanadaCaribbeanCentral AmericaChileChinaColombiaCongoCosta RicaCroatiaCubaCzechoslovakiaDenmarkDominicaDominican RepublicEastern AfricaEastern AsiaEastern EuropeEcuadorEgyptEl SalvadorEnglandEritreaEthiopiaEuropeFijiFranceGermanyGhanaGreeceGrenadaGuatemalaGuyanaHaitiHondurasHong KongHungaryIndiaIndonesiaIranIraqIrelandIsraelItalyJamaicaJapanJordanKazakhstanKenyaKoreaKuwaitLaosLatin AmericaLatviaLebanonLiberiaLithuaniaMalaysiaMexicoMicronesiaMiddle AfricaMoldovaMoroccoNepalNetherlandsNicaraguaNigeriaNorth AmericaNorth MacedoniaNorthern AfricaNorthern EuropeNorwayOceaniaPakistanPanamaPeruPhilippinesPolandPortugalRomaniaRussiaSaudi ArabiaScotlandSenegalSerbiaSierra LeoneSingaporeSomaliaSouth AfricaSouth AmericaSouth Central AsiaSouth Eastern AsiaSouthern EuropeSpainSri LankaSt. Vincent and the GrenadinesSudanSwedenSwitzerlandSyriaTaiwanThailandTrinidad and TobagoTurkeyUgandaUkraineUruguayUzbekistanVenezuelaVietnamWest IndiesWestern AfricaWestern AsiaWestern EuropeYemenZaireAzores
Immigrants from Zimbabwe
Race
Ancestry
AfghanAfricanAlaska NativeAlaskan AthabascanAlbanianAleutAlsatianAmericanApacheArabArapahoArgentineanArmenianAssyrian/Chaldean/SyriacAustralianAustrianBahamianBangladeshiBarbadianBasqueBelgianBelizeanBermudanBhutaneseBlackfeetBolivianBrazilianBritishBritish West IndianBulgarianBurmeseCajunCambodianCanadianCape VerdeanCarpatho RusynCelticCentral AmericanCentral American IndianCherokeeCheyenneChickasawChileanChineseChippewaChoctawColombianColvilleComancheCosta RicanCreeCreekCroatianCrowCubanCypriotCzechCzechoslovakianDanishDelawareDominicanDutchDutch West IndianEastern EuropeanEcuadorianEgyptianEnglishEstonianEthiopianEuropeanFijianFilipinoFinnishFrenchFrench American IndianFrench CanadianGermanGerman RussianGhanaianGreekGuamanian/ChamorroGuatemalanGuyaneseHaitianHmongHonduranHopiHoumaHungarianIcelanderIndian (Asian)IndonesianInupiatIranianIraqiIrishIroquoisIsraeliItalianJamaicanJapaneseJordanianKenyanKiowaKoreanLaotianLatvianLebaneseLiberianLithuanianLumbeeLuxembourgerMacedonianMalaysianMalteseMarshalleseMenomineeMexicanMexican American IndianMongolianMoroccanNative HawaiianNavajoNepaleseNew ZealanderNicaraguanNigerianNorthern EuropeanNorwegianOkinawanOsageOttawaPaiutePakistaniPalestinianPanamanianParaguayanPennsylvania GermanPeruvianPimaPolishPortuguesePotawatomiPuebloPuerto RicanPuget Sound SalishRomanianRussianSalvadoranSamoanScandinavianScotch-IrishScottishSeminoleSenegaleseSerbianShoshoneSierra LeoneanSiouxSlavicSlovakSloveneSomaliSouth AfricanSouth AmericanSouth American IndianSoviet UnionSpaniardSpanishSpanish AmericanSpanish American IndianSri LankanSubsaharan AfricanSudaneseSwedishSwissSyrianTaiwaneseThaiTlingit-HaidaTohono O'OdhamTonganTrinidadian and TobagonianTsimshianTurkishU.S. Virgin IslanderUgandanUkrainianUruguayanUteVenezuelanVietnameseWelshWest IndianYakamaYaquiYugoslavianYumanYup'ikZimbabwean
Immigration
NonimmigrantsImmigrantsAfghanistanAfricaAlbaniaArgentinaArmeniaAsiaAustraliaAustriaBahamasBangladeshBarbadosBelarusBelgiumBelizeBoliviaBosnia and HerzegovinaBrazilBulgariaBurma/MyanmarCabo VerdeCambodiaCameroonCanadaCaribbeanCentral AmericaChileChinaColombiaCongoCosta RicaCroatiaCubaCzechoslovakiaDenmarkDominicaDominican RepublicEastern AfricaEastern AsiaEastern EuropeEcuadorEgyptEl SalvadorEnglandEritreaEthiopiaEuropeFijiFranceGermanyGhanaGreeceGrenadaGuatemalaGuyanaHaitiHondurasHong KongHungaryIndiaIndonesiaIranIraqIsraelItalyJamaicaJapanJordanKazakhstanKenyaKoreaKuwaitLaosLatin AmericaLatviaLebanonLiberiaLithuaniaMalaysiaMexicoMicronesiaMiddle AfricaMoldovaMoroccoNepalNetherlandsNicaraguaNigeriaNorth AmericaNorth MacedoniaNorthern AfricaNorthern EuropeNorwayOceaniaPakistanPanamaPeruPhilippinesPolandPortugalRomaniaRussiaSaudi ArabiaScotlandSenegalSerbiaSierra LeoneSingaporeSomaliaSouth AfricaSouth AmericaSouth Central AsiaSouth Eastern AsiaSouthern EuropeSpainSri LankaSt. Vincent and the GrenadinesSudanSwedenSwitzerlandSyriaTaiwanThailandTrinidad and TobagoTurkeyUgandaUkraineUruguayUzbekistanVenezuelaVietnamWest IndiesWestern AfricaWestern AsiaWestern EuropeYemenZaireZimbabweAzores
In Labor Force | Age 45-54
Income
Poverty
Unemployment
Labor Participation
Family Structure
Vehicle Availability
Education Level
Disability

In Labor Force | Age 45-54 Comparison

Immigrants from Ireland

Immigrants from Zimbabwe

Exceptional
Exceptional
83.9%
IN LABOR FORCE | AGE 45-54
99.8/ 100
METRIC RATING
22nd/ 347
METRIC RANK
83.4%
IN LABOR FORCE | AGE 45-54
96.3/ 100
METRIC RATING
83rd/ 347
METRIC RANK

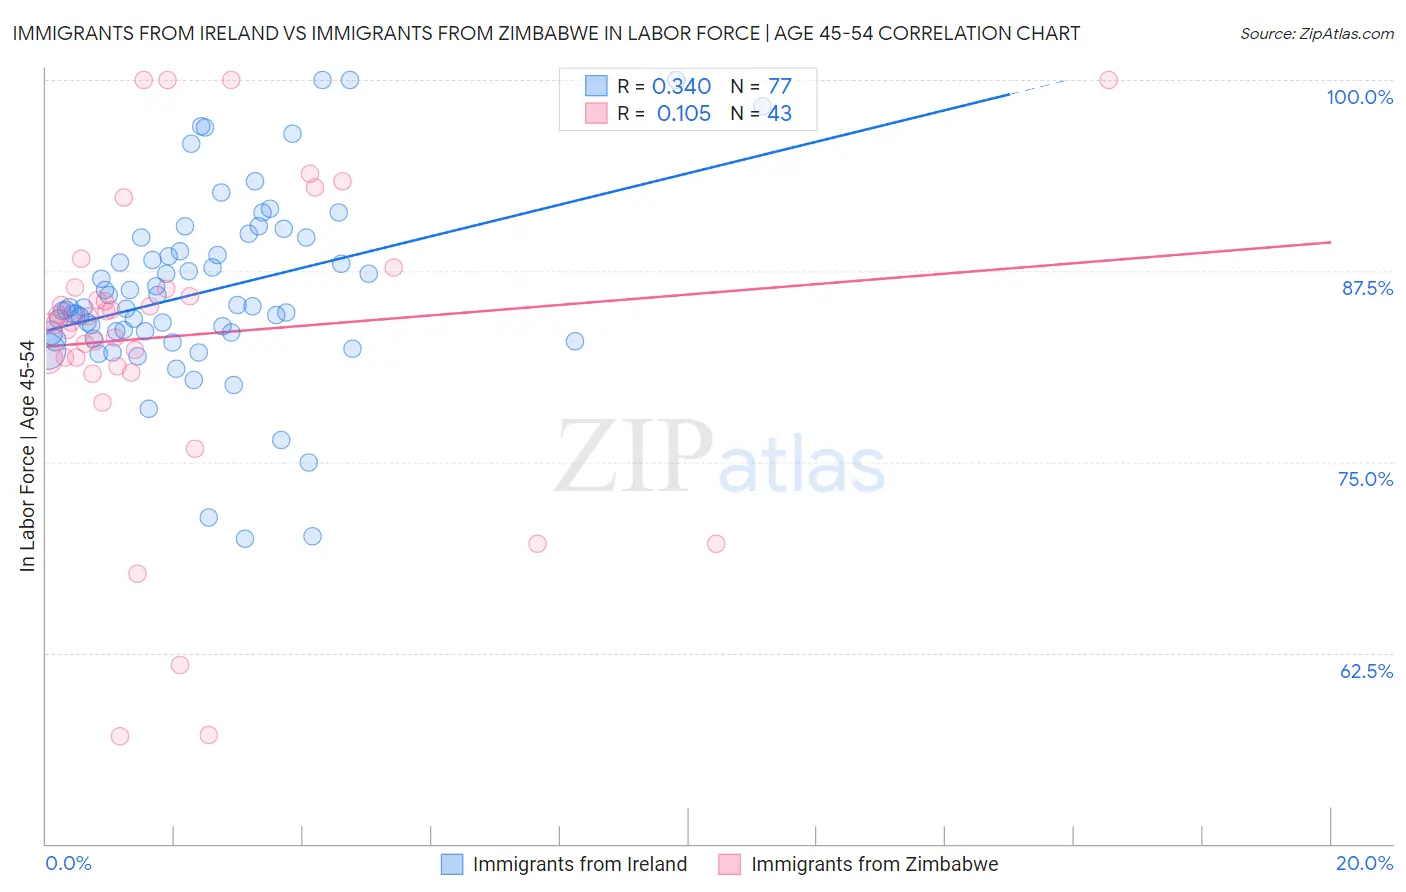
Immigrants from Ireland vs Immigrants from Zimbabwe In Labor Force | Age 45-54 Correlation Chart

The statistical analysis conducted on geographies consisting of 240,747,816 people shows a mild positive correlation between the proportion of Immigrants from Ireland and labor force participation rate among population between the ages 45 and 54 in the United States with a correlation coefficient (R) of 0.340 and weighted average of 83.9%. Similarly, the statistical analysis conducted on geographies consisting of 117,788,320 people shows a poor positive correlation between the proportion of Immigrants from Zimbabwe and labor force participation rate among population between the ages 45 and 54 in the United States with a correlation coefficient (R) of 0.105 and weighted average of 83.4%, a difference of 0.68%.
Immigrants from Ireland vs Immigrants from Zimbabwe In Labor Force | Age 45-54

In Labor Force | Age 45-54 Correlation Summary

MeasurementImmigrants from IrelandImmigrants from Zimbabwe
Minimum70.0%57.0%
Maximum100.0%100.0%
Range30.0%43.0%
Mean86.1%83.3%
Median85.1%84.1%
Interquartile 25% (IQ1)83.2%81.2%
Interquartile 75% (IQ3)89.2%86.4%
Interquartile Range (IQR)6.0%5.1%
Standard Deviation (Sample)6.1%10.0%
Standard Deviation (Population)6.0%9.8%

Similar Demographics by In Labor Force | Age 45-54

Demographics Similar to Immigrants from Ireland by In Labor Force | Age 45-54

In terms of in labor force | age 45-54, the demographic groups most similar to Immigrants from Ireland are Immigrants from Eastern Africa (83.9%, a difference of 0.0%), Immigrants from Sri Lanka (83.9%, a difference of 0.0%), Tlingit-Haida (83.9%, a difference of 0.0%), Czech (83.9%, a difference of 0.010%), and Slovene (83.9%, a difference of 0.010%).
DemographicsRating | RankIn Labor Force | Age 45-54
Cypriots
99.9
/100
|
#15
Exceptional
84.1%
Immigrants | Nepal
99.9
/100
|
#16
Exceptional
84.0%
Zimbabweans
99.9
/100
|
#17
Exceptional
84.0%
Immigrants | South Central Asia
99.9
/100
|
#18
Exceptional
84.0%
Czechs
99.8
/100
|
#19
Exceptional
83.9%
Immigrants | Eastern Africa
99.8
/100
|
#20
Exceptional
83.9%
Immigrants | Sri Lanka
99.8
/100
|
#21
Exceptional
83.9%
Immigrants | Ireland
99.8
/100
|
#22
Exceptional
83.9%
Tlingit-Haida
99.8
/100
|
#23
Exceptional
83.9%
Slovenes
99.8
/100
|
#24
Exceptional
83.9%
Immigrants | North Macedonia
99.8
/100
|
#25
Exceptional
83.9%
Immigrants | Serbia
99.8
/100
|
#26
Exceptional
83.9%
Immigrants | Brazil
99.8
/100
|
#27
Exceptional
83.9%
Immigrants | Lithuania
99.8
/100
|
#28
Exceptional
83.9%
Immigrants | Pakistan
99.7
/100
|
#29
Exceptional
83.8%

Demographics Similar to Immigrants from Zimbabwe by In Labor Force | Age 45-54

In terms of in labor force | age 45-54, the demographic groups most similar to Immigrants from Zimbabwe are Immigrants from Eastern Asia (83.4%, a difference of 0.0%), Immigrants from Croatia (83.4%, a difference of 0.010%), Jordanian (83.4%, a difference of 0.010%), Immigrants from Bosnia and Herzegovina (83.3%, a difference of 0.010%), and Immigrants from Egypt (83.4%, a difference of 0.020%).
DemographicsRating | RankIn Labor Force | Age 45-54
Russians
96.8
/100
|
#76
Exceptional
83.4%
Cubans
96.7
/100
|
#77
Exceptional
83.4%
Immigrants | Egypt
96.6
/100
|
#78
Exceptional
83.4%
Belgians
96.5
/100
|
#79
Exceptional
83.4%
Immigrants | Croatia
96.5
/100
|
#80
Exceptional
83.4%
Jordanians
96.4
/100
|
#81
Exceptional
83.4%
Immigrants | Eastern Asia
96.3
/100
|
#82
Exceptional
83.4%
Immigrants | Zimbabwe
96.3
/100
|
#83
Exceptional
83.4%
Immigrants | Bosnia and Herzegovina
96.0
/100
|
#84
Exceptional
83.3%
Greeks
95.9
/100
|
#85
Exceptional
83.3%
Immigrants | Northern Africa
95.7
/100
|
#86
Exceptional
83.3%
Immigrants | Eastern Europe
95.6
/100
|
#87
Exceptional
83.3%
Immigrants | Asia
95.6
/100
|
#88
Exceptional
83.3%
Indians (Asian)
95.5
/100
|
#89
Exceptional
83.3%
Immigrants | Japan
95.5
/100
|
#90
Exceptional
83.3%