Syrian vs Immigrants from Sudan In Labor Force | Age 45-54
COMPARE
Syrian
Immigrants from Sudan
In Labor Force | Age 45-54
In Labor Force | Age 45-54 Comparison
Syrians
Immigrants from Sudan
82.6%
IN LABOR FORCE | AGE 45-54
26.0/ 100
METRIC RATING
189th/ 347
METRIC RANK
82.8%
IN LABOR FORCE | AGE 45-54
59.9/ 100
METRIC RATING
165th/ 347
METRIC RANK
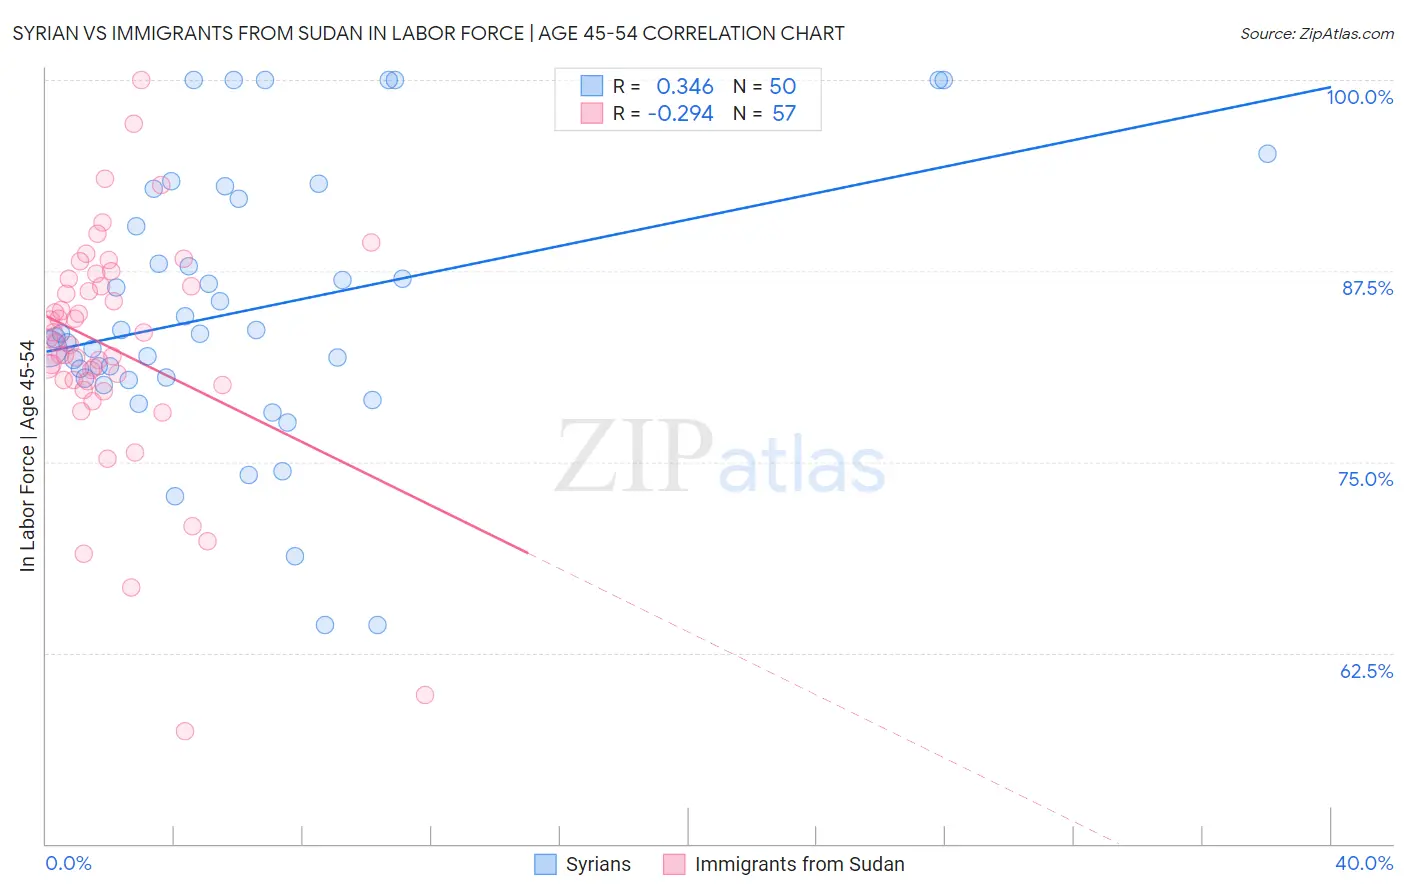
Syrian vs Immigrants from Sudan In Labor Force | Age 45-54 Correlation Chart
The statistical analysis conducted on geographies consisting of 266,195,129 people shows a mild positive correlation between the proportion of Syrians and labor force participation rate among population between the ages 45 and 54 in the United States with a correlation coefficient (R) of 0.346 and weighted average of 82.6%. Similarly, the statistical analysis conducted on geographies consisting of 118,941,177 people shows a weak negative correlation between the proportion of Immigrants from Sudan and labor force participation rate among population between the ages 45 and 54 in the United States with a correlation coefficient (R) of -0.294 and weighted average of 82.8%, a difference of 0.32%.
In Labor Force | Age 45-54 Correlation Summary
| Measurement | Syrian | Immigrants from Sudan |
| Minimum | 64.3% | 57.4% |
| Maximum | 100.0% | 100.0% |
| Range | 35.7% | 42.6% |
| Mean | 85.0% | 82.4% |
| Median | 83.4% | 82.8% |
| Interquartile 25% (IQ1) | 80.5% | 80.2% |
| Interquartile 75% (IQ3) | 92.2% | 86.8% |
| Interquartile Range (IQR) | 11.7% | 6.6% |
| Standard Deviation (Sample) | 8.9% | 7.7% |
| Standard Deviation (Population) | 8.9% | 7.6% |
Similar Demographics by In Labor Force | Age 45-54
Demographics Similar to Syrians by In Labor Force | Age 45-54
In terms of in labor force | age 45-54, the demographic groups most similar to Syrians are British (82.6%, a difference of 0.0%), South African (82.6%, a difference of 0.020%), Irish (82.6%, a difference of 0.030%), Immigrants from Costa Rica (82.6%, a difference of 0.030%), and Armenian (82.5%, a difference of 0.030%).
| Demographics | Rating | Rank | In Labor Force | Age 45-54 |
| Immigrants | Hungary | 37.1 /100 | #182 | Fair 82.7% |
| New Zealanders | 32.7 /100 | #183 | Fair 82.6% |
| Europeans | 32.6 /100 | #184 | Fair 82.6% |
| Immigrants | England | 32.2 /100 | #185 | Fair 82.6% |
| Irish | 29.2 /100 | #186 | Fair 82.6% |
| Immigrants | Costa Rica | 28.3 /100 | #187 | Fair 82.6% |
| South Africans | 28.0 /100 | #188 | Fair 82.6% |
| Syrians | 26.0 /100 | #189 | Fair 82.6% |
| British | 25.7 /100 | #190 | Fair 82.6% |
| Armenians | 23.2 /100 | #191 | Fair 82.5% |
| Immigrants | Iraq | 20.9 /100 | #192 | Fair 82.5% |
| Australians | 20.8 /100 | #193 | Fair 82.5% |
| Immigrants | Norway | 20.7 /100 | #194 | Fair 82.5% |
| Immigrants | Canada | 20.0 /100 | #195 | Fair 82.5% |
| Immigrants | North America | 18.8 /100 | #196 | Poor 82.5% |
Demographics Similar to Immigrants from Sudan by In Labor Force | Age 45-54
In terms of in labor force | age 45-54, the demographic groups most similar to Immigrants from Sudan are German Russian (82.8%, a difference of 0.010%), South American Indian (82.9%, a difference of 0.020%), Haitian (82.8%, a difference of 0.020%), Dutch (82.8%, a difference of 0.020%), and Immigrants from South Eastern Asia (82.8%, a difference of 0.020%).
| Demographics | Rating | Rank | In Labor Force | Age 45-54 |
| Immigrants | Southern Europe | 67.8 /100 | #158 | Good 82.9% |
| Immigrants | Austria | 64.6 /100 | #159 | Good 82.9% |
| Laotians | 62.8 /100 | #160 | Good 82.9% |
| South American Indians | 62.2 /100 | #161 | Good 82.9% |
| Haitians | 61.8 /100 | #162 | Good 82.8% |
| Dutch | 61.7 /100 | #163 | Good 82.8% |
| German Russians | 61.3 /100 | #164 | Good 82.8% |
| Immigrants | Sudan | 59.9 /100 | #165 | Average 82.8% |
| Immigrants | South Eastern Asia | 57.4 /100 | #166 | Average 82.8% |
| Swiss | 56.5 /100 | #167 | Average 82.8% |
| Immigrants | South Africa | 55.8 /100 | #168 | Average 82.8% |
| Immigrants | Western Africa | 54.1 /100 | #169 | Average 82.8% |
| Pakistanis | 53.2 /100 | #170 | Average 82.8% |
| Immigrants | Zaire | 52.9 /100 | #171 | Average 82.8% |
| Icelanders | 51.8 /100 | #172 | Average 82.8% |