Russian vs Immigrants from Cameroon In Labor Force | Age 25-29
COMPARE
Russian
Immigrants from Cameroon
In Labor Force | Age 25-29
In Labor Force | Age 25-29 Comparison
Russians
Immigrants from Cameroon
85.3%
IN LABOR FORCE | AGE 25-29
98.8/ 100
METRIC RATING
73rd/ 347
METRIC RANK
85.4%
IN LABOR FORCE | AGE 25-29
99.2/ 100
METRIC RATING
68th/ 347
METRIC RANK
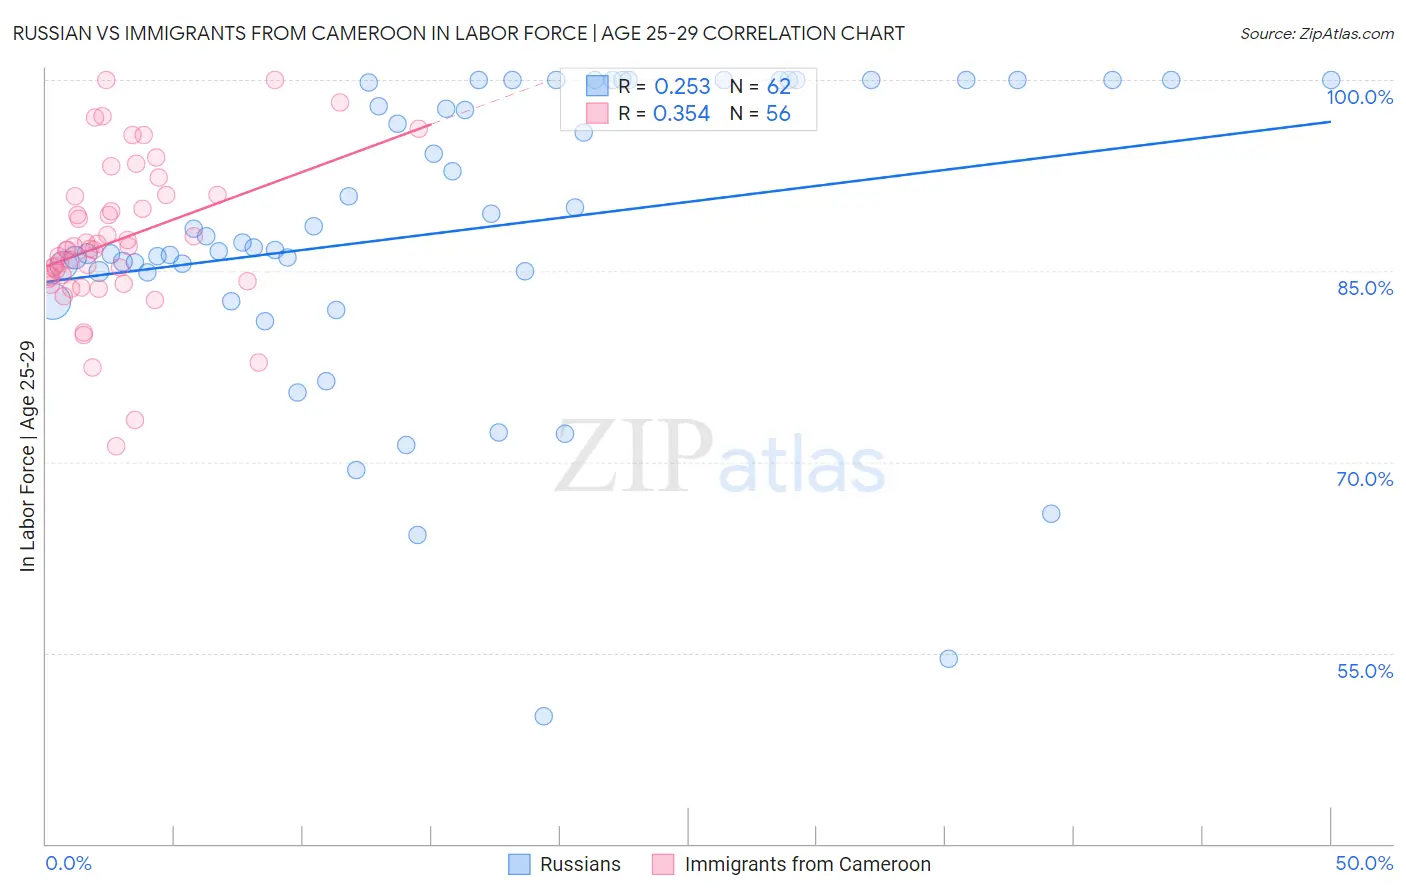
Russian vs Immigrants from Cameroon In Labor Force | Age 25-29 Correlation Chart
The statistical analysis conducted on geographies consisting of 511,687,113 people shows a weak positive correlation between the proportion of Russians and labor force participation rate among population between the ages 25 and 29 in the United States with a correlation coefficient (R) of 0.253 and weighted average of 85.3%. Similarly, the statistical analysis conducted on geographies consisting of 130,753,894 people shows a mild positive correlation between the proportion of Immigrants from Cameroon and labor force participation rate among population between the ages 25 and 29 in the United States with a correlation coefficient (R) of 0.354 and weighted average of 85.4%, a difference of 0.070%.
In Labor Force | Age 25-29 Correlation Summary
| Measurement | Russian | Immigrants from Cameroon |
| Minimum | 50.0% | 71.2% |
| Maximum | 100.0% | 100.0% |
| Range | 50.0% | 28.8% |
| Mean | 88.2% | 87.5% |
| Median | 87.5% | 86.7% |
| Interquartile 25% (IQ1) | 85.0% | 84.4% |
| Interquartile 75% (IQ3) | 100.0% | 90.9% |
| Interquartile Range (IQR) | 15.0% | 6.5% |
| Standard Deviation (Sample) | 11.7% | 6.0% |
| Standard Deviation (Population) | 11.6% | 5.9% |
Demographics Similar to Russians and Immigrants from Cameroon by In Labor Force | Age 25-29
In terms of in labor force | age 25-29, the demographic groups most similar to Russians are Immigrants from Australia (85.3%, a difference of 0.010%), Kenyan (85.4%, a difference of 0.030%), Immigrants from Sweden (85.4%, a difference of 0.040%), Soviet Union (85.3%, a difference of 0.040%), and Menominee (85.4%, a difference of 0.050%). Similarly, the demographic groups most similar to Immigrants from Cameroon are Immigrants from Turkey (85.4%, a difference of 0.010%), Immigrants from Czechoslovakia (85.4%, a difference of 0.020%), Immigrants from Scotland (85.4%, a difference of 0.020%), Menominee (85.4%, a difference of 0.020%), and Immigrants from Sweden (85.4%, a difference of 0.020%).
| Demographics | Rating | Rank | In Labor Force | Age 25-29 |
| Thais | 99.5 /100 | #60 | Exceptional 85.5% |
| Serbians | 99.5 /100 | #61 | Exceptional 85.5% |
| Taiwanese | 99.4 /100 | #62 | Exceptional 85.4% |
| Immigrants | Kenya | 99.4 /100 | #63 | Exceptional 85.4% |
| Immigrants | Italy | 99.3 /100 | #64 | Exceptional 85.4% |
| Immigrants | Czechoslovakia | 99.3 /100 | #65 | Exceptional 85.4% |
| Immigrants | Scotland | 99.3 /100 | #66 | Exceptional 85.4% |
| Immigrants | Turkey | 99.2 /100 | #67 | Exceptional 85.4% |
| Immigrants | Cameroon | 99.2 /100 | #68 | Exceptional 85.4% |
| Menominee | 99.1 /100 | #69 | Exceptional 85.4% |
| Immigrants | Sweden | 99.1 /100 | #70 | Exceptional 85.4% |
| Kenyans | 99.0 /100 | #71 | Exceptional 85.4% |
| Immigrants | Australia | 98.9 /100 | #72 | Exceptional 85.3% |
| Russians | 98.8 /100 | #73 | Exceptional 85.3% |
| Soviet Union | 98.5 /100 | #74 | Exceptional 85.3% |
| Brazilians | 98.3 /100 | #75 | Exceptional 85.3% |
| Germans | 98.1 /100 | #76 | Exceptional 85.3% |
| Immigrants | South Central Asia | 97.9 /100 | #77 | Exceptional 85.2% |
| Immigrants | Egypt | 97.7 /100 | #78 | Exceptional 85.2% |
| Immigrants | Northern Africa | 97.6 /100 | #79 | Exceptional 85.2% |
| Immigrants | Zimbabwe | 97.6 /100 | #80 | Exceptional 85.2% |