Puerto Rican vs Scandinavian In Labor Force | Age 16-19
COMPARE
Puerto Rican
Scandinavian
In Labor Force | Age 16-19
In Labor Force | Age 16-19 Comparison
Puerto Ricans
Scandinavians
30.3%
IN LABOR FORCE | AGE 16-19
0.0/ 100
METRIC RATING
334th/ 347
METRIC RANK
43.6%
IN LABOR FORCE | AGE 16-19
100.0/ 100
METRIC RATING
17th/ 347
METRIC RANK
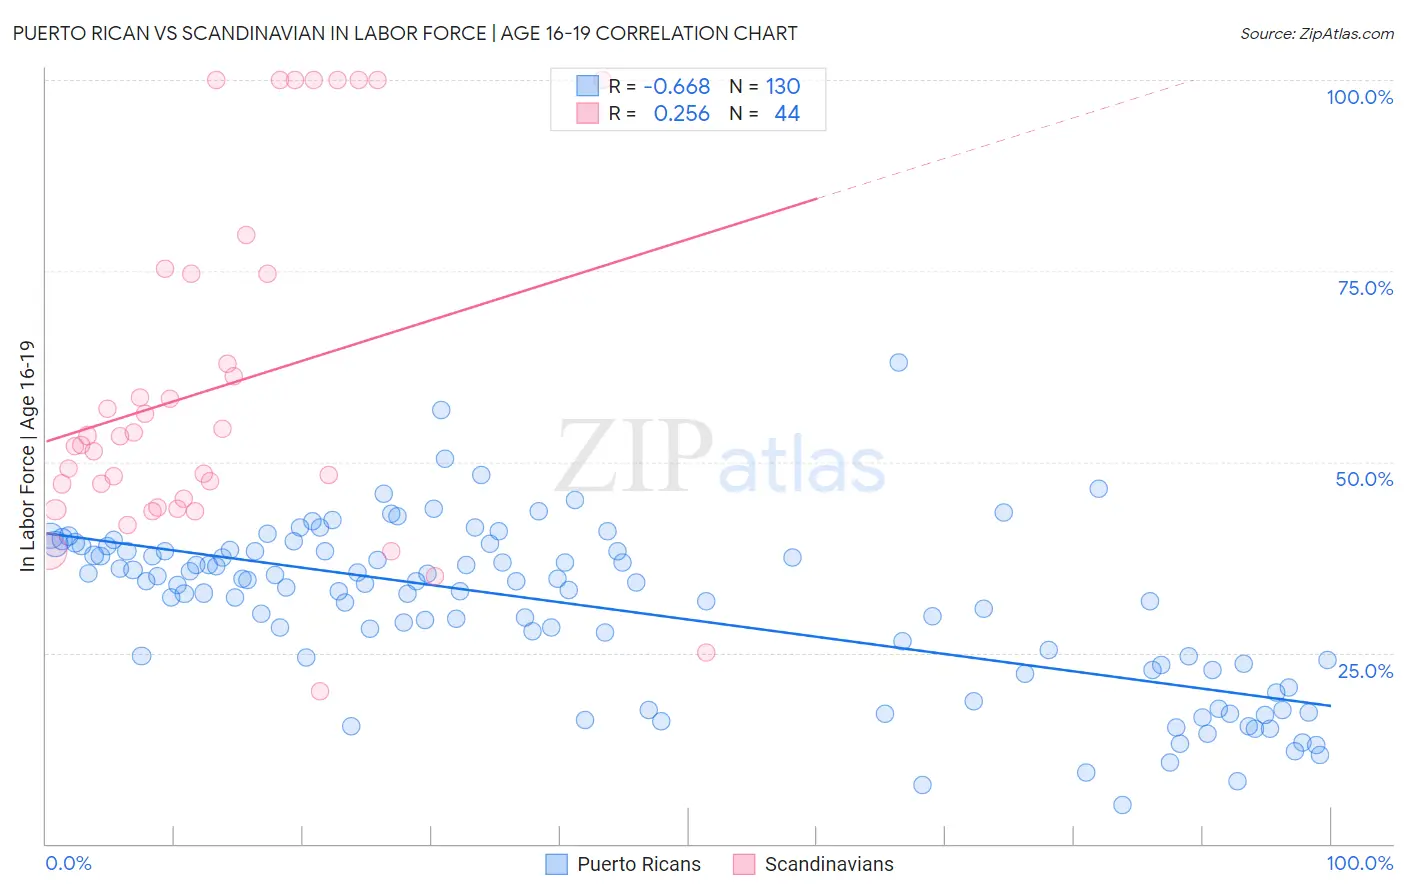
Puerto Rican vs Scandinavian In Labor Force | Age 16-19 Correlation Chart
The statistical analysis conducted on geographies consisting of 526,303,316 people shows a significant negative correlation between the proportion of Puerto Ricans and labor force participation rate among population between the ages 16 and 19 in the United States with a correlation coefficient (R) of -0.668 and weighted average of 30.3%. Similarly, the statistical analysis conducted on geographies consisting of 471,147,409 people shows a weak positive correlation between the proportion of Scandinavians and labor force participation rate among population between the ages 16 and 19 in the United States with a correlation coefficient (R) of 0.256 and weighted average of 43.6%, a difference of 43.7%.
In Labor Force | Age 16-19 Correlation Summary
| Measurement | Puerto Rican | Scandinavian |
| Minimum | 5.1% | 20.0% |
| Maximum | 63.0% | 100.0% |
| Range | 57.9% | 80.0% |
| Mean | 31.0% | 59.7% |
| Median | 34.0% | 52.8% |
| Interquartile 25% (IQ1) | 23.4% | 44.6% |
| Interquartile 75% (IQ3) | 38.3% | 74.6% |
| Interquartile Range (IQR) | 14.9% | 30.0% |
| Standard Deviation (Sample) | 10.9% | 22.4% |
| Standard Deviation (Population) | 10.8% | 22.1% |
Similar Demographics by In Labor Force | Age 16-19
Demographics Similar to Puerto Ricans by In Labor Force | Age 16-19
In terms of in labor force | age 16-19, the demographic groups most similar to Puerto Ricans are Immigrants from Cuba (30.2%, a difference of 0.33%), Immigrants from Hong Kong (30.5%, a difference of 0.42%), Immigrants from Israel (30.5%, a difference of 0.44%), Immigrants from Trinidad and Tobago (30.2%, a difference of 0.62%), and Immigrants from Bangladesh (30.0%, a difference of 0.99%).
| Demographics | Rating | Rank | In Labor Force | Age 16-19 |
| Immigrants | Taiwan | 0.0 /100 | #327 | Tragic 31.0% |
| Immigrants | Ecuador | 0.0 /100 | #328 | Tragic 31.0% |
| Barbadians | 0.0 /100 | #329 | Tragic 31.0% |
| Lumbee | 0.0 /100 | #330 | Tragic 31.0% |
| Trinidadians and Tobagonians | 0.0 /100 | #331 | Tragic 30.9% |
| Immigrants | Israel | 0.0 /100 | #332 | Tragic 30.5% |
| Immigrants | Hong Kong | 0.0 /100 | #333 | Tragic 30.5% |
| Puerto Ricans | 0.0 /100 | #334 | Tragic 30.3% |
| Immigrants | Cuba | 0.0 /100 | #335 | Tragic 30.2% |
| Immigrants | Trinidad and Tobago | 0.0 /100 | #336 | Tragic 30.2% |
| Immigrants | Bangladesh | 0.0 /100 | #337 | Tragic 30.0% |
| Vietnamese | 0.0 /100 | #338 | Tragic 29.6% |
| Immigrants | Uzbekistan | 0.0 /100 | #339 | Tragic 29.2% |
| British West Indians | 0.0 /100 | #340 | Tragic 29.1% |
| Immigrants | Armenia | 0.0 /100 | #341 | Tragic 29.0% |
Demographics Similar to Scandinavians by In Labor Force | Age 16-19
In terms of in labor force | age 16-19, the demographic groups most similar to Scandinavians are Czech (43.6%, a difference of 0.070%), French Canadian (43.6%, a difference of 0.070%), Slovene (43.7%, a difference of 0.17%), Chippewa (43.8%, a difference of 0.43%), and Dutch (43.8%, a difference of 0.53%).
| Demographics | Rating | Rank | In Labor Force | Age 16-19 |
| Germans | 100.0 /100 | #10 | Exceptional 44.2% |
| Swedes | 100.0 /100 | #11 | Exceptional 44.1% |
| Finns | 100.0 /100 | #12 | Exceptional 43.9% |
| Dutch | 100.0 /100 | #13 | Exceptional 43.8% |
| Chippewa | 100.0 /100 | #14 | Exceptional 43.8% |
| Slovenes | 100.0 /100 | #15 | Exceptional 43.7% |
| Czechs | 100.0 /100 | #16 | Exceptional 43.6% |
| Scandinavians | 100.0 /100 | #17 | Exceptional 43.6% |
| French Canadians | 100.0 /100 | #18 | Exceptional 43.6% |
| Belgians | 100.0 /100 | #19 | Exceptional 43.4% |
| Swiss | 100.0 /100 | #20 | Exceptional 43.3% |
| Ottawa | 100.0 /100 | #21 | Exceptional 43.0% |
| Sudanese | 100.0 /100 | #22 | Exceptional 42.9% |
| Slovaks | 100.0 /100 | #23 | Exceptional 42.6% |
| Bangladeshis | 100.0 /100 | #24 | Exceptional 42.5% |