Pueblo vs Immigrants from Micronesia Female Poverty Among 25-34 Year Olds
COMPARE
Pueblo
Immigrants from Micronesia
Female Poverty Among 25-34 Year Olds
Female Poverty Among 25-34 Year Olds Comparison
Pueblo
Immigrants from Micronesia
22.2%
FEMALE POVERTY AMONG 25-34 YEAR OLDS
0.0/ 100
METRIC RATING
336th/ 347
METRIC RANK
15.8%
FEMALE POVERTY AMONG 25-34 YEAR OLDS
0.0/ 100
METRIC RATING
277th/ 347
METRIC RANK
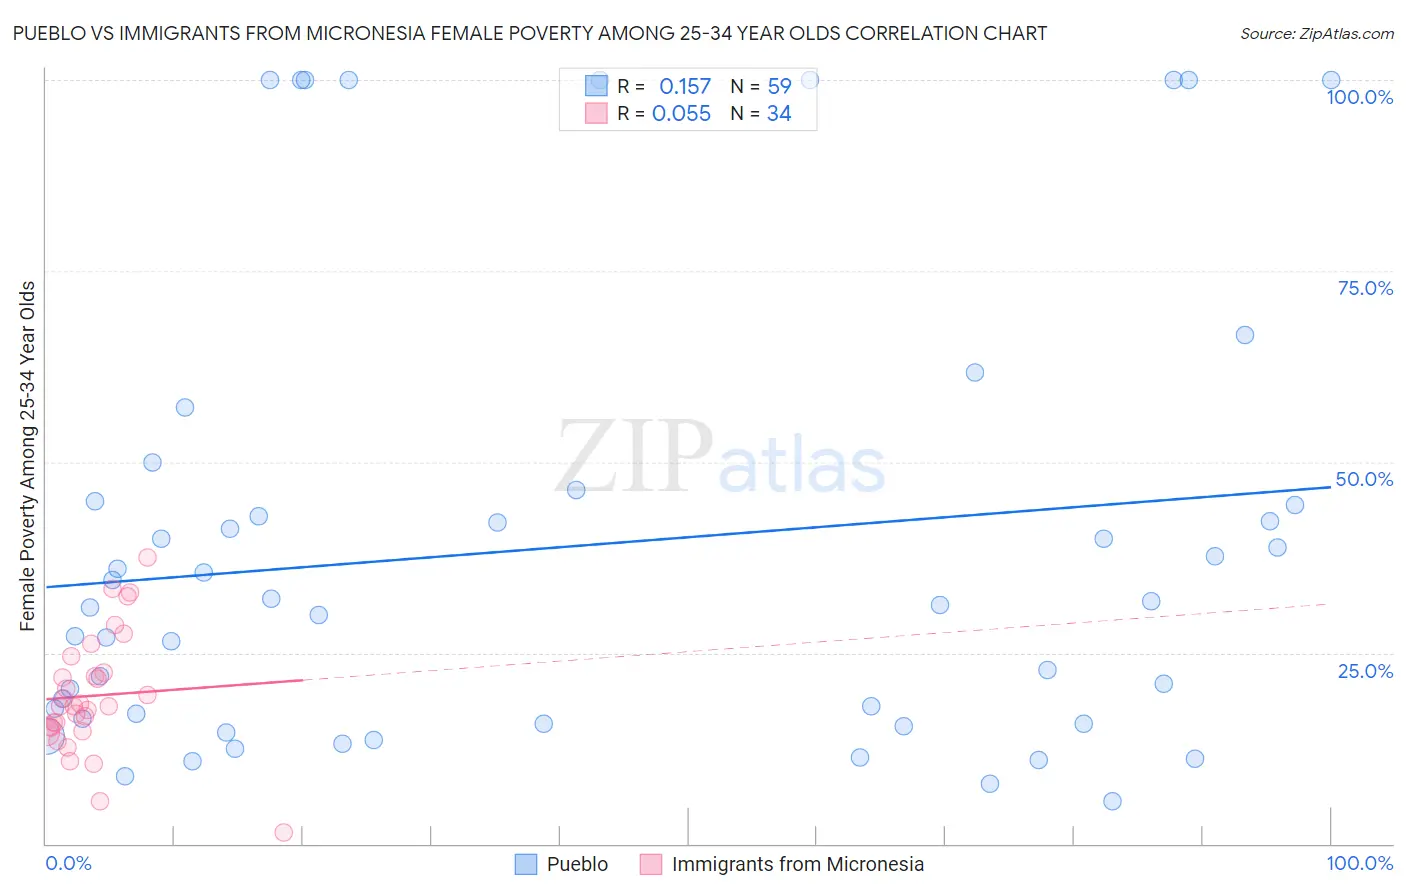
Pueblo vs Immigrants from Micronesia Female Poverty Among 25-34 Year Olds Correlation Chart
The statistical analysis conducted on geographies consisting of 119,661,710 people shows a poor positive correlation between the proportion of Pueblo and poverty level among females between the ages 25 and 34 in the United States with a correlation coefficient (R) of 0.157 and weighted average of 22.2%. Similarly, the statistical analysis conducted on geographies consisting of 61,523,063 people shows a slight positive correlation between the proportion of Immigrants from Micronesia and poverty level among females between the ages 25 and 34 in the United States with a correlation coefficient (R) of 0.055 and weighted average of 15.8%, a difference of 40.0%.
Female Poverty Among 25-34 Year Olds Correlation Summary
| Measurement | Pueblo | Immigrants from Micronesia |
| Minimum | 5.6% | 1.5% |
| Maximum | 100.0% | 37.5% |
| Range | 94.4% | 36.0% |
| Mean | 38.9% | 19.4% |
| Median | 31.2% | 18.0% |
| Interquartile 25% (IQ1) | 15.8% | 15.2% |
| Interquartile 75% (IQ3) | 44.9% | 22.4% |
| Interquartile Range (IQR) | 29.1% | 7.2% |
| Standard Deviation (Sample) | 29.6% | 7.8% |
| Standard Deviation (Population) | 29.3% | 7.7% |
Similar Demographics by Female Poverty Among 25-34 Year Olds
Demographics Similar to Pueblo by Female Poverty Among 25-34 Year Olds
In terms of female poverty among 25-34 year olds, the demographic groups most similar to Pueblo are Crow (22.7%, a difference of 2.3%), Houma (22.7%, a difference of 2.5%), Yuman (22.9%, a difference of 3.4%), Sioux (23.0%, a difference of 3.5%), and Navajo (23.3%, a difference of 5.3%).
| Demographics | Rating | Rank | Female Poverty Among 25-34 Year Olds |
| Creek | 0.0 /100 | #329 | Tragic 19.2% |
| Paiute | 0.0 /100 | #330 | Tragic 19.6% |
| Kiowa | 0.0 /100 | #331 | Tragic 19.7% |
| Immigrants | Yemen | 0.0 /100 | #332 | Tragic 19.8% |
| Cajuns | 0.0 /100 | #333 | Tragic 19.9% |
| Apache | 0.0 /100 | #334 | Tragic 20.1% |
| Natives/Alaskans | 0.0 /100 | #335 | Tragic 20.3% |
| Pueblo | 0.0 /100 | #336 | Tragic 22.2% |
| Crow | 0.0 /100 | #337 | Tragic 22.7% |
| Houma | 0.0 /100 | #338 | Tragic 22.7% |
| Yuman | 0.0 /100 | #339 | Tragic 22.9% |
| Sioux | 0.0 /100 | #340 | Tragic 23.0% |
| Navajo | 0.0 /100 | #341 | Tragic 23.3% |
| Hopi | 0.0 /100 | #342 | Tragic 23.7% |
| Yup'ik | 0.0 /100 | #343 | Tragic 24.3% |
Demographics Similar to Immigrants from Micronesia by Female Poverty Among 25-34 Year Olds
In terms of female poverty among 25-34 year olds, the demographic groups most similar to Immigrants from Micronesia are Immigrants from Zaire (15.8%, a difference of 0.010%), French American Indian (15.9%, a difference of 0.29%), Fijian (15.9%, a difference of 0.29%), Immigrants from the Azores (15.8%, a difference of 0.44%), and Bangladeshi (15.9%, a difference of 0.45%).
| Demographics | Rating | Rank | Female Poverty Among 25-34 Year Olds |
| British West Indians | 0.1 /100 | #270 | Tragic 15.6% |
| Cree | 0.1 /100 | #271 | Tragic 15.6% |
| Senegalese | 0.1 /100 | #272 | Tragic 15.6% |
| Immigrants | Nonimmigrants | 0.1 /100 | #273 | Tragic 15.6% |
| Immigrants | Caribbean | 0.0 /100 | #274 | Tragic 15.7% |
| Immigrants | Azores | 0.0 /100 | #275 | Tragic 15.8% |
| Immigrants | Zaire | 0.0 /100 | #276 | Tragic 15.8% |
| Immigrants | Micronesia | 0.0 /100 | #277 | Tragic 15.8% |
| French American Indians | 0.0 /100 | #278 | Tragic 15.9% |
| Fijians | 0.0 /100 | #279 | Tragic 15.9% |
| Bangladeshis | 0.0 /100 | #280 | Tragic 15.9% |
| Immigrants | Latin America | 0.0 /100 | #281 | Tragic 16.0% |
| Aleuts | 0.0 /100 | #282 | Tragic 16.1% |
| Bahamians | 0.0 /100 | #283 | Tragic 16.1% |
| Shoshone | 0.0 /100 | #284 | Tragic 16.2% |