Czech vs Immigrants from Eastern Asia In Labor Force | Age 16-19
COMPARE
Czech
Immigrants from Eastern Asia
In Labor Force | Age 16-19
In Labor Force | Age 16-19 Comparison
Czechs
Immigrants from Eastern Asia
43.6%
IN LABOR FORCE | AGE 16-19
100.0/ 100
METRIC RATING
16th/ 347
METRIC RANK
32.0%
IN LABOR FORCE | AGE 16-19
0.0/ 100
METRIC RATING
309th/ 347
METRIC RANK
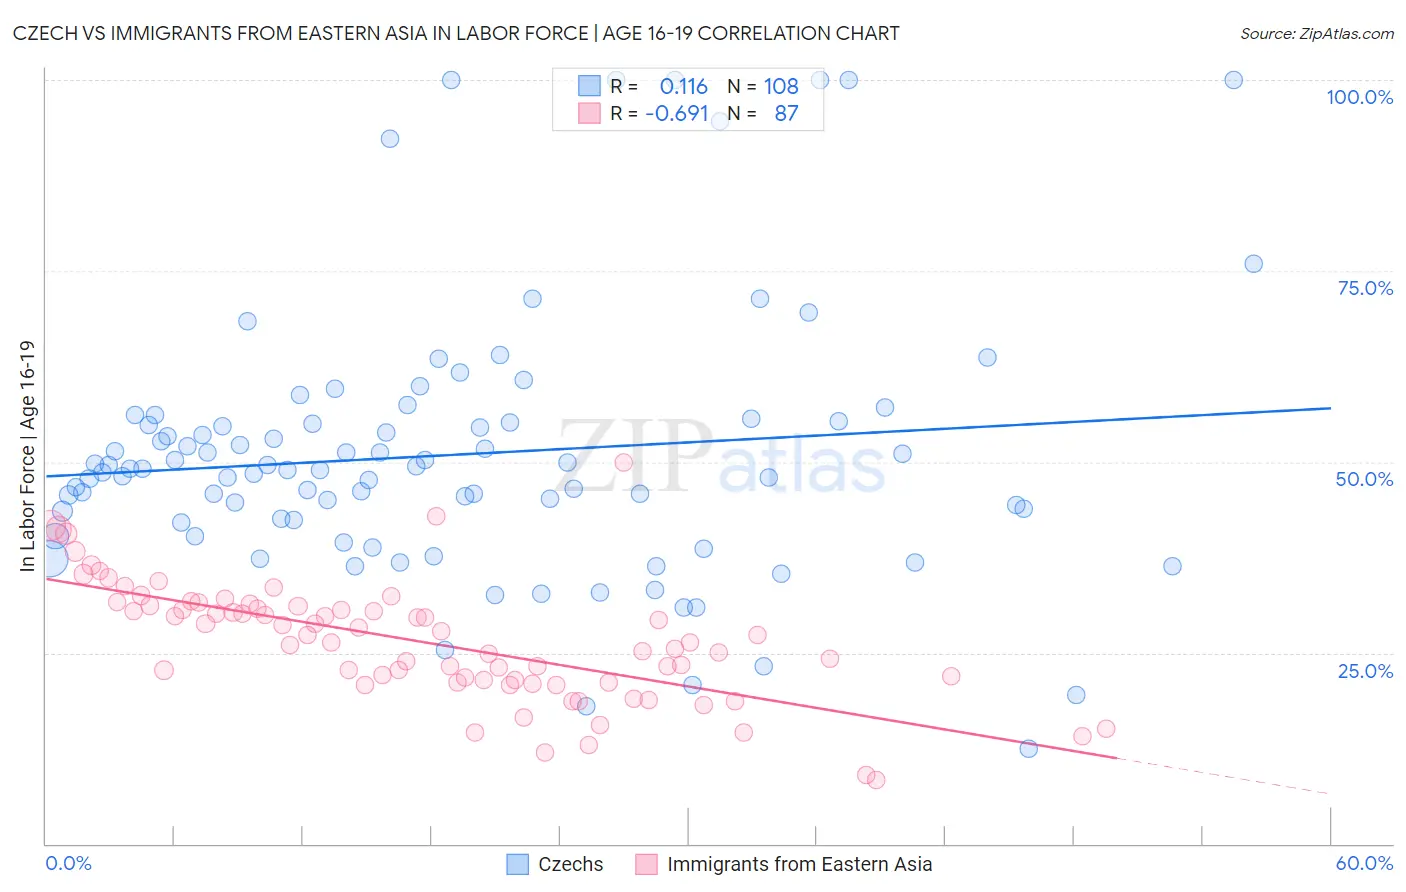
Czech vs Immigrants from Eastern Asia In Labor Force | Age 16-19 Correlation Chart
The statistical analysis conducted on geographies consisting of 483,278,851 people shows a poor positive correlation between the proportion of Czechs and labor force participation rate among population between the ages 16 and 19 in the United States with a correlation coefficient (R) of 0.116 and weighted average of 43.6%. Similarly, the statistical analysis conducted on geographies consisting of 498,676,879 people shows a significant negative correlation between the proportion of Immigrants from Eastern Asia and labor force participation rate among population between the ages 16 and 19 in the United States with a correlation coefficient (R) of -0.691 and weighted average of 32.0%, a difference of 36.3%.
In Labor Force | Age 16-19 Correlation Summary
| Measurement | Czech | Immigrants from Eastern Asia |
| Minimum | 12.5% | 8.3% |
| Maximum | 100.0% | 50.0% |
| Range | 87.5% | 41.7% |
| Mean | 50.9% | 26.4% |
| Median | 49.1% | 26.4% |
| Interquartile 25% (IQ1) | 42.3% | 21.2% |
| Interquartile 75% (IQ3) | 55.2% | 31.2% |
| Interquartile Range (IQR) | 13.0% | 10.0% |
| Standard Deviation (Sample) | 17.5% | 7.7% |
| Standard Deviation (Population) | 17.4% | 7.7% |
Similar Demographics by In Labor Force | Age 16-19
Demographics Similar to Czechs by In Labor Force | Age 16-19
In terms of in labor force | age 16-19, the demographic groups most similar to Czechs are Scandinavian (43.6%, a difference of 0.070%), Slovene (43.7%, a difference of 0.11%), French Canadian (43.6%, a difference of 0.14%), Chippewa (43.8%, a difference of 0.36%), and Dutch (43.8%, a difference of 0.47%).
| Demographics | Rating | Rank | In Labor Force | Age 16-19 |
| Cape Verdeans | 100.0 /100 | #9 | Exceptional 44.5% |
| Germans | 100.0 /100 | #10 | Exceptional 44.2% |
| Swedes | 100.0 /100 | #11 | Exceptional 44.1% |
| Finns | 100.0 /100 | #12 | Exceptional 43.9% |
| Dutch | 100.0 /100 | #13 | Exceptional 43.8% |
| Chippewa | 100.0 /100 | #14 | Exceptional 43.8% |
| Slovenes | 100.0 /100 | #15 | Exceptional 43.7% |
| Czechs | 100.0 /100 | #16 | Exceptional 43.6% |
| Scandinavians | 100.0 /100 | #17 | Exceptional 43.6% |
| French Canadians | 100.0 /100 | #18 | Exceptional 43.6% |
| Belgians | 100.0 /100 | #19 | Exceptional 43.4% |
| Swiss | 100.0 /100 | #20 | Exceptional 43.3% |
| Ottawa | 100.0 /100 | #21 | Exceptional 43.0% |
| Sudanese | 100.0 /100 | #22 | Exceptional 42.9% |
| Slovaks | 100.0 /100 | #23 | Exceptional 42.6% |
Demographics Similar to Immigrants from Eastern Asia by In Labor Force | Age 16-19
In terms of in labor force | age 16-19, the demographic groups most similar to Immigrants from Eastern Asia are Immigrants from Iran (32.0%, a difference of 0.14%), Navajo (32.1%, a difference of 0.18%), Indian (Asian) (31.9%, a difference of 0.50%), Immigrants from Jamaica (32.2%, a difference of 0.53%), and Immigrants from Belize (31.8%, a difference of 0.65%).
| Demographics | Rating | Rank | In Labor Force | Age 16-19 |
| Belizeans | 0.0 /100 | #302 | Tragic 32.8% |
| Immigrants | Dominica | 0.0 /100 | #303 | Tragic 32.5% |
| Israelis | 0.0 /100 | #304 | Tragic 32.4% |
| Nicaraguans | 0.0 /100 | #305 | Tragic 32.4% |
| Spanish American Indians | 0.0 /100 | #306 | Tragic 32.4% |
| Immigrants | Jamaica | 0.0 /100 | #307 | Tragic 32.2% |
| Navajo | 0.0 /100 | #308 | Tragic 32.1% |
| Immigrants | Eastern Asia | 0.0 /100 | #309 | Tragic 32.0% |
| Immigrants | Iran | 0.0 /100 | #310 | Tragic 32.0% |
| Indians (Asian) | 0.0 /100 | #311 | Tragic 31.9% |
| Immigrants | Belize | 0.0 /100 | #312 | Tragic 31.8% |
| Hopi | 0.0 /100 | #313 | Tragic 31.8% |
| Cubans | 0.0 /100 | #314 | Tragic 31.8% |
| Immigrants | West Indies | 0.0 /100 | #315 | Tragic 31.7% |
| Filipinos | 0.0 /100 | #316 | Tragic 31.7% |