Immigrants from Iran vs Eastern European In Labor Force | Age 25-29
COMPARE
Immigrants from Iran
Eastern European
In Labor Force | Age 25-29
In Labor Force | Age 25-29 Comparison
Immigrants from Iran
Eastern Europeans
84.9%
IN LABOR FORCE | AGE 25-29
84.8/ 100
METRIC RATING
124th/ 347
METRIC RANK
85.5%
IN LABOR FORCE | AGE 25-29
99.6/ 100
METRIC RATING
56th/ 347
METRIC RANK
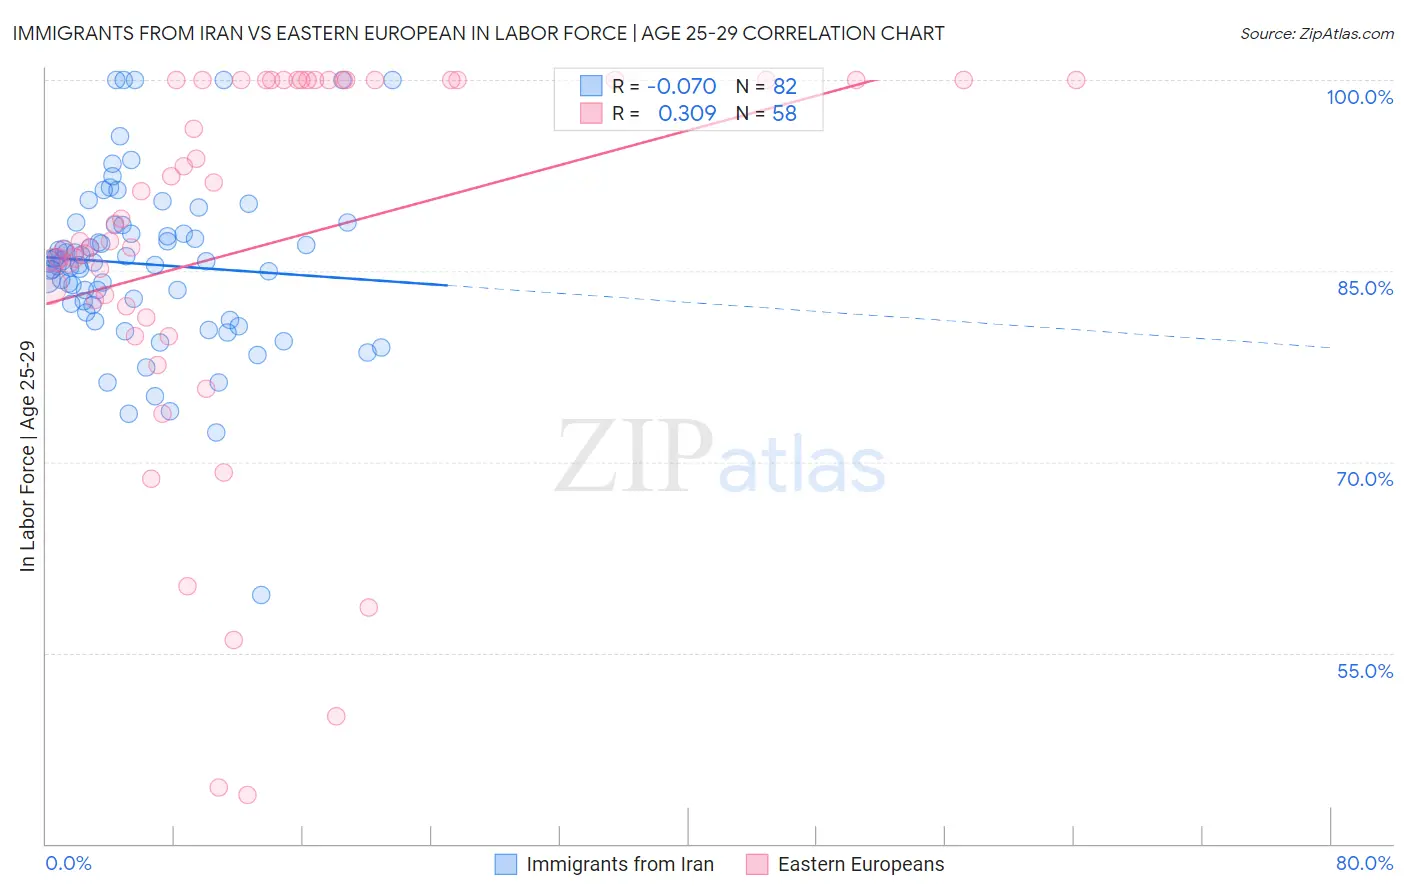
Immigrants from Iran vs Eastern European In Labor Force | Age 25-29 Correlation Chart
The statistical analysis conducted on geographies consisting of 279,858,438 people shows a slight negative correlation between the proportion of Immigrants from Iran and labor force participation rate among population between the ages 25 and 29 in the United States with a correlation coefficient (R) of -0.070 and weighted average of 84.9%. Similarly, the statistical analysis conducted on geographies consisting of 460,900,054 people shows a mild positive correlation between the proportion of Eastern Europeans and labor force participation rate among population between the ages 25 and 29 in the United States with a correlation coefficient (R) of 0.309 and weighted average of 85.5%, a difference of 0.69%.
In Labor Force | Age 25-29 Correlation Summary
| Measurement | Immigrants from Iran | Eastern European |
| Minimum | 59.5% | 43.8% |
| Maximum | 100.0% | 100.0% |
| Range | 40.5% | 56.2% |
| Mean | 85.5% | 86.9% |
| Median | 85.7% | 88.0% |
| Interquartile 25% (IQ1) | 82.3% | 82.2% |
| Interquartile 75% (IQ3) | 88.6% | 100.0% |
| Interquartile Range (IQR) | 6.3% | 17.8% |
| Standard Deviation (Sample) | 6.8% | 14.9% |
| Standard Deviation (Population) | 6.7% | 14.7% |
Similar Demographics by In Labor Force | Age 25-29
Demographics Similar to Immigrants from Iran by In Labor Force | Age 25-29
In terms of in labor force | age 25-29, the demographic groups most similar to Immigrants from Iran are Scandinavian (84.9%, a difference of 0.0%), Dutch (84.9%, a difference of 0.0%), Uruguayan (84.9%, a difference of 0.0%), Immigrants from Chile (84.9%, a difference of 0.010%), and Immigrants from Singapore (84.9%, a difference of 0.010%).
| Demographics | Rating | Rank | In Labor Force | Age 25-29 |
| Immigrants | Belarus | 88.0 /100 | #117 | Excellent 85.0% |
| Finns | 87.8 /100 | #118 | Excellent 85.0% |
| Filipinos | 87.1 /100 | #119 | Excellent 84.9% |
| Immigrants | South Africa | 86.1 /100 | #120 | Excellent 84.9% |
| Immigrants | Chile | 85.6 /100 | #121 | Excellent 84.9% |
| Scandinavians | 85.1 /100 | #122 | Excellent 84.9% |
| Dutch | 84.9 /100 | #123 | Excellent 84.9% |
| Immigrants | Iran | 84.8 /100 | #124 | Excellent 84.9% |
| Uruguayans | 84.7 /100 | #125 | Excellent 84.9% |
| Immigrants | Singapore | 84.4 /100 | #126 | Excellent 84.9% |
| Immigrants | Uruguay | 84.0 /100 | #127 | Excellent 84.9% |
| Australians | 83.6 /100 | #128 | Excellent 84.9% |
| Immigrants | Russia | 81.6 /100 | #129 | Excellent 84.9% |
| Northern Europeans | 81.3 /100 | #130 | Excellent 84.9% |
| Iranians | 78.1 /100 | #131 | Good 84.8% |
Demographics Similar to Eastern Europeans by In Labor Force | Age 25-29
In terms of in labor force | age 25-29, the demographic groups most similar to Eastern Europeans are Estonian (85.5%, a difference of 0.010%), Greek (85.5%, a difference of 0.010%), Immigrants from Morocco (85.5%, a difference of 0.020%), Immigrants from Brazil (85.5%, a difference of 0.030%), and Belgian (85.5%, a difference of 0.040%).
| Demographics | Rating | Rank | In Labor Force | Age 25-29 |
| Swedes | 99.8 /100 | #49 | Exceptional 85.6% |
| Yugoslavians | 99.8 /100 | #50 | Exceptional 85.6% |
| Immigrants | Latvia | 99.8 /100 | #51 | Exceptional 85.6% |
| Immigrants | Poland | 99.7 /100 | #52 | Exceptional 85.6% |
| Belgians | 99.7 /100 | #53 | Exceptional 85.5% |
| Albanians | 99.7 /100 | #54 | Exceptional 85.5% |
| Immigrants | Brazil | 99.7 /100 | #55 | Exceptional 85.5% |
| Eastern Europeans | 99.6 /100 | #56 | Exceptional 85.5% |
| Estonians | 99.6 /100 | #57 | Exceptional 85.5% |
| Greeks | 99.6 /100 | #58 | Exceptional 85.5% |
| Immigrants | Morocco | 99.5 /100 | #59 | Exceptional 85.5% |
| Thais | 99.5 /100 | #60 | Exceptional 85.5% |
| Serbians | 99.5 /100 | #61 | Exceptional 85.5% |
| Taiwanese | 99.4 /100 | #62 | Exceptional 85.4% |
| Immigrants | Kenya | 99.4 /100 | #63 | Exceptional 85.4% |