Peruvian vs Immigrants from Serbia In Labor Force | Age 16-19
COMPARE
Peruvian
Immigrants from Serbia
In Labor Force | Age 16-19
In Labor Force | Age 16-19 Comparison
Peruvians
Immigrants from Serbia
34.6%
IN LABOR FORCE | AGE 16-19
1.4/ 100
METRIC RATING
255th/ 347
METRIC RANK
36.0%
IN LABOR FORCE | AGE 16-19
21.0/ 100
METRIC RATING
197th/ 347
METRIC RANK
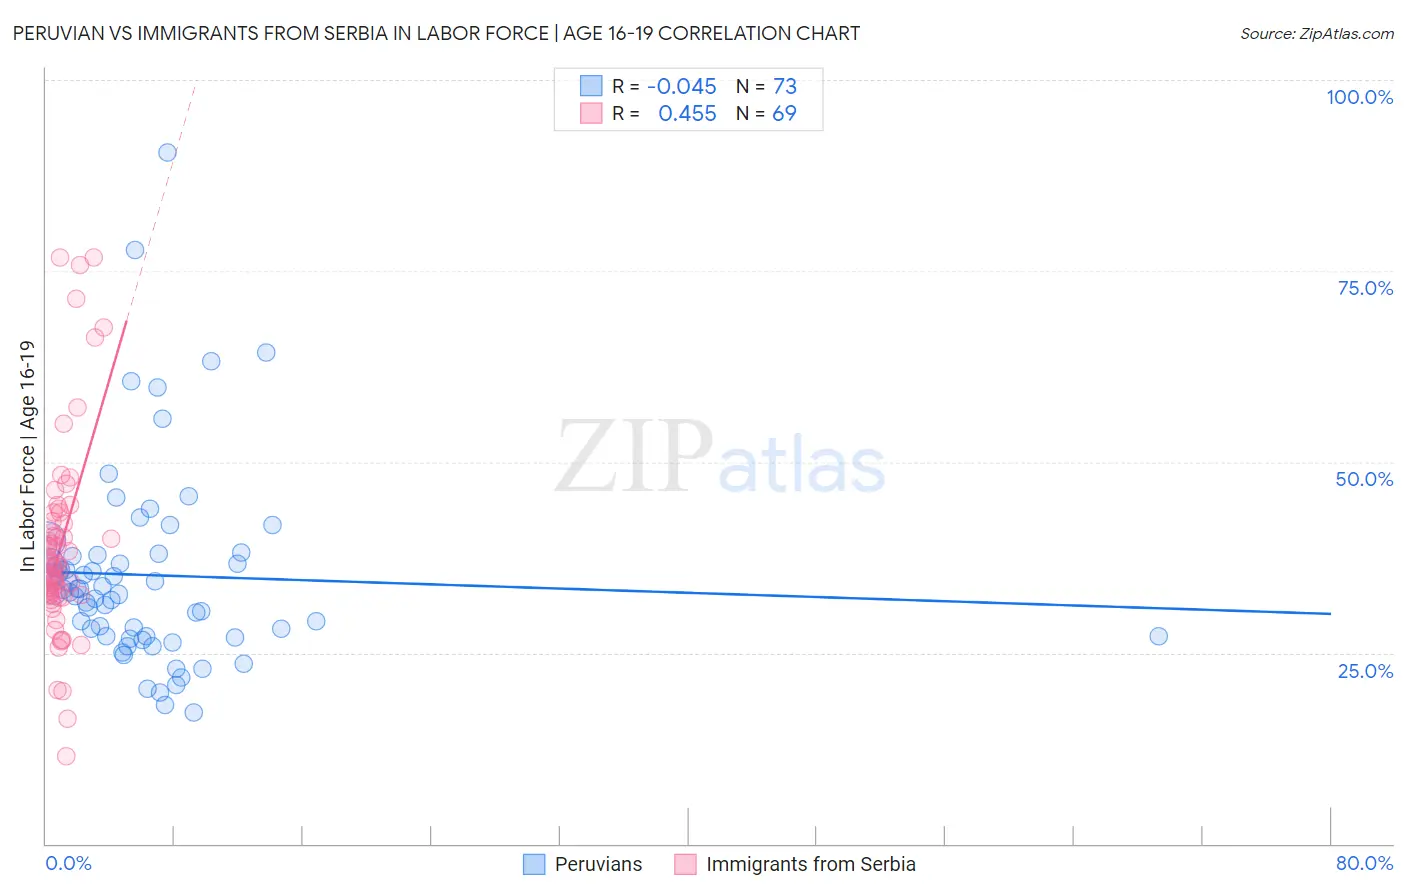
Peruvian vs Immigrants from Serbia In Labor Force | Age 16-19 Correlation Chart
The statistical analysis conducted on geographies consisting of 362,835,907 people shows no correlation between the proportion of Peruvians and labor force participation rate among population between the ages 16 and 19 in the United States with a correlation coefficient (R) of -0.045 and weighted average of 34.6%. Similarly, the statistical analysis conducted on geographies consisting of 131,679,358 people shows a moderate positive correlation between the proportion of Immigrants from Serbia and labor force participation rate among population between the ages 16 and 19 in the United States with a correlation coefficient (R) of 0.455 and weighted average of 36.0%, a difference of 3.9%.
In Labor Force | Age 16-19 Correlation Summary
| Measurement | Peruvian | Immigrants from Serbia |
| Minimum | 17.1% | 11.5% |
| Maximum | 90.5% | 76.8% |
| Range | 73.4% | 65.3% |
| Mean | 35.2% | 39.0% |
| Median | 33.0% | 36.5% |
| Interquartile 25% (IQ1) | 27.1% | 32.6% |
| Interquartile 75% (IQ3) | 37.8% | 42.8% |
| Interquartile Range (IQR) | 10.6% | 10.2% |
| Standard Deviation (Sample) | 12.9% | 13.1% |
| Standard Deviation (Population) | 12.8% | 13.0% |
Similar Demographics by In Labor Force | Age 16-19
Demographics Similar to Peruvians by In Labor Force | Age 16-19
In terms of in labor force | age 16-19, the demographic groups most similar to Peruvians are Bahamian (34.6%, a difference of 0.040%), Immigrants from South Central Asia (34.6%, a difference of 0.11%), Immigrants from Egypt (34.6%, a difference of 0.11%), Thai (34.6%, a difference of 0.12%), and Immigrants (34.6%, a difference of 0.13%).
| Demographics | Rating | Rank | In Labor Force | Age 16-19 |
| Central Americans | 2.2 /100 | #248 | Tragic 34.8% |
| Immigrants | Ukraine | 2.2 /100 | #249 | Tragic 34.8% |
| Immigrants | Pakistan | 2.0 /100 | #250 | Tragic 34.8% |
| Immigrants | Western Asia | 2.0 /100 | #251 | Tragic 34.8% |
| Immigrants | Chile | 2.0 /100 | #252 | Tragic 34.8% |
| Immigrants | Japan | 1.5 /100 | #253 | Tragic 34.7% |
| Bahamians | 1.4 /100 | #254 | Tragic 34.6% |
| Peruvians | 1.4 /100 | #255 | Tragic 34.6% |
| Immigrants | South Central Asia | 1.3 /100 | #256 | Tragic 34.6% |
| Immigrants | Egypt | 1.2 /100 | #257 | Tragic 34.6% |
| Thais | 1.2 /100 | #258 | Tragic 34.6% |
| Immigrants | Immigrants | 1.2 /100 | #259 | Tragic 34.6% |
| Egyptians | 1.2 /100 | #260 | Tragic 34.5% |
| Salvadorans | 1.1 /100 | #261 | Tragic 34.5% |
| Hispanics or Latinos | 1.1 /100 | #262 | Tragic 34.5% |
Demographics Similar to Immigrants from Serbia by In Labor Force | Age 16-19
In terms of in labor force | age 16-19, the demographic groups most similar to Immigrants from Serbia are Mexican American Indian (36.0%, a difference of 0.010%), Immigrants from Northern Africa (35.9%, a difference of 0.080%), Immigrants from Norway (35.9%, a difference of 0.090%), Bolivian (36.0%, a difference of 0.17%), and Immigrants from Sweden (35.9%, a difference of 0.17%).
| Demographics | Rating | Rank | In Labor Force | Age 16-19 |
| Panamanians | 28.6 /100 | #190 | Fair 36.1% |
| Immigrants | Croatia | 27.5 /100 | #191 | Fair 36.1% |
| Afghans | 25.7 /100 | #192 | Fair 36.1% |
| Immigrants | Denmark | 25.0 /100 | #193 | Fair 36.1% |
| Nigerians | 24.6 /100 | #194 | Fair 36.1% |
| Bolivians | 23.3 /100 | #195 | Fair 36.0% |
| Mexican American Indians | 21.1 /100 | #196 | Fair 36.0% |
| Immigrants | Serbia | 21.0 /100 | #197 | Fair 36.0% |
| Immigrants | Northern Africa | 19.9 /100 | #198 | Poor 35.9% |
| Immigrants | Norway | 19.8 /100 | #199 | Poor 35.9% |
| Immigrants | Sweden | 18.8 /100 | #200 | Poor 35.9% |
| Alsatians | 17.5 /100 | #201 | Poor 35.9% |
| Senegalese | 17.4 /100 | #202 | Poor 35.9% |
| Immigrants | Nigeria | 16.8 /100 | #203 | Poor 35.8% |
| Immigrants | Albania | 15.0 /100 | #204 | Poor 35.8% |