Paraguayan vs Immigrants from Sweden Householder Income Under 25 years
COMPARE
Paraguayan
Immigrants from Sweden
Householder Income Under 25 years
Householder Income Under 25 years Comparison
Paraguayans
Immigrants from Sweden
$55,614
HOUSEHOLDER INCOME UNDER 25 YEARS
100.0/ 100
METRIC RATING
44th/ 347
METRIC RANK
$53,621
HOUSEHOLDER INCOME UNDER 25 YEARS
97.1/ 100
METRIC RATING
114th/ 347
METRIC RANK
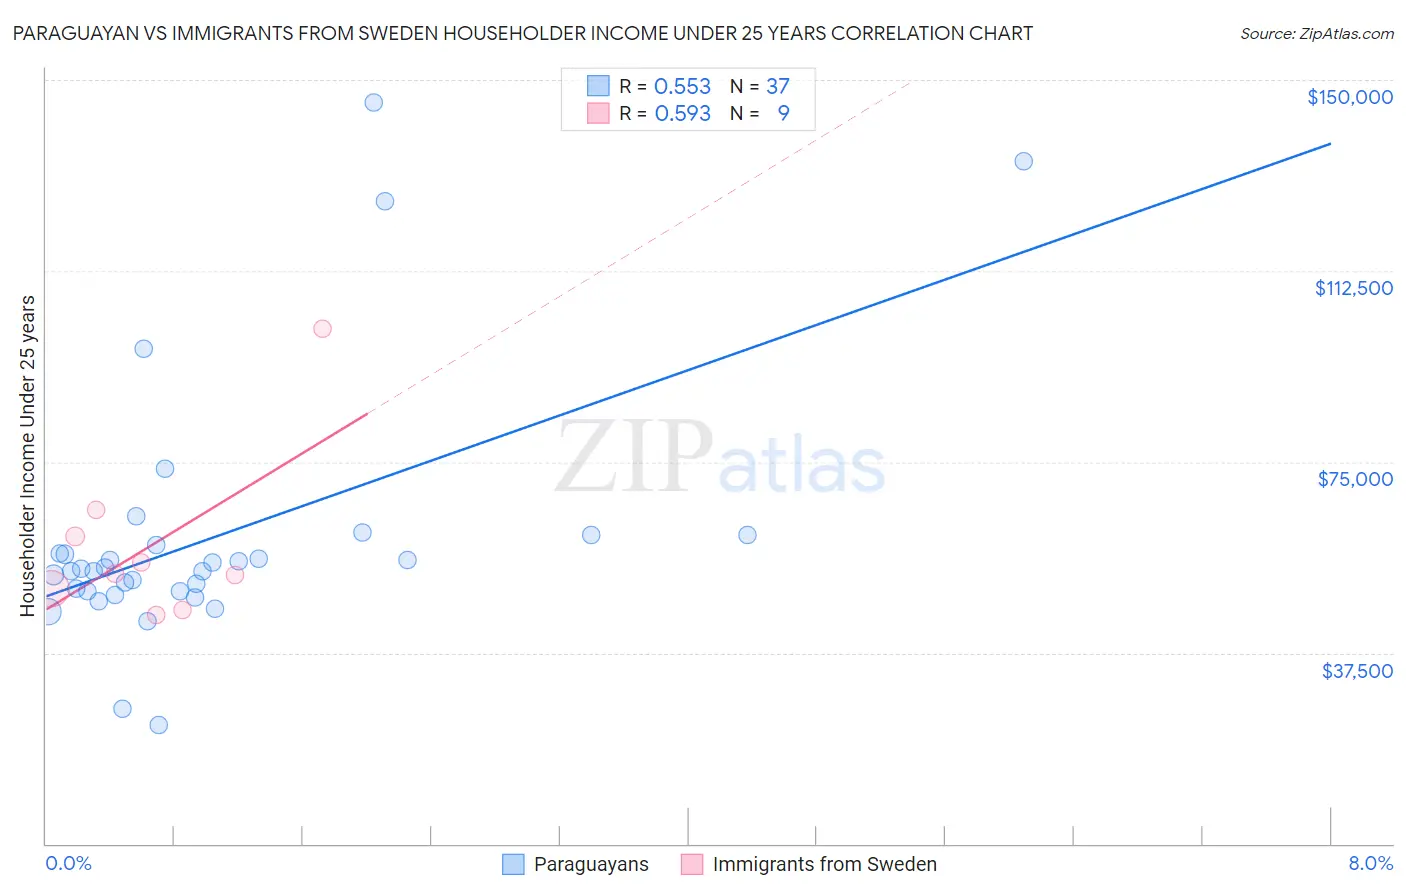
Paraguayan vs Immigrants from Sweden Householder Income Under 25 years Correlation Chart
The statistical analysis conducted on geographies consisting of 88,924,769 people shows a substantial positive correlation between the proportion of Paraguayans and household income with householder under the age of 25 in the United States with a correlation coefficient (R) of 0.553 and weighted average of $55,614. Similarly, the statistical analysis conducted on geographies consisting of 146,742,584 people shows a substantial positive correlation between the proportion of Immigrants from Sweden and household income with householder under the age of 25 in the United States with a correlation coefficient (R) of 0.593 and weighted average of $53,621, a difference of 3.7%.
Householder Income Under 25 years Correlation Summary
| Measurement | Paraguayan | Immigrants from Sweden |
| Minimum | $23,438 | $44,957 |
| Maximum | $145,536 | $101,141 |
| Range | $122,098 | $56,184 |
| Mean | $60,245 | $58,786 |
| Median | $54,059 | $52,949 |
| Interquartile 25% (IQ1) | $49,601 | $48,010 |
| Interquartile 75% (IQ3) | $59,594 | $62,961 |
| Interquartile Range (IQR) | $9,992 | $14,951 |
| Standard Deviation (Sample) | $25,388 | $17,165 |
| Standard Deviation (Population) | $25,042 | $16,183 |
Similar Demographics by Householder Income Under 25 years
Demographics Similar to Paraguayans by Householder Income Under 25 years
In terms of householder income under 25 years, the demographic groups most similar to Paraguayans are Spanish American Indian ($55,573, a difference of 0.070%), Immigrants from Eastern Europe ($55,572, a difference of 0.070%), Cambodian ($55,571, a difference of 0.080%), Immigrants from Vietnam ($55,562, a difference of 0.090%), and Iranian ($55,548, a difference of 0.12%).
| Demographics | Rating | Rank | Householder Income Under 25 years |
| Immigrants | Russia | 100.0 /100 | #37 | Exceptional $55,891 |
| Immigrants | Iran | 100.0 /100 | #38 | Exceptional $55,880 |
| Immigrants | Belarus | 100.0 /100 | #39 | Exceptional $55,743 |
| Immigrants | Greece | 100.0 /100 | #40 | Exceptional $55,727 |
| Immigrants | Guyana | 100.0 /100 | #41 | Exceptional $55,726 |
| Immigrants | Korea | 100.0 /100 | #42 | Exceptional $55,716 |
| Immigrants | South Eastern Asia | 100.0 /100 | #43 | Exceptional $55,714 |
| Paraguayans | 100.0 /100 | #44 | Exceptional $55,614 |
| Spanish American Indians | 100.0 /100 | #45 | Exceptional $55,573 |
| Immigrants | Eastern Europe | 100.0 /100 | #46 | Exceptional $55,572 |
| Cambodians | 100.0 /100 | #47 | Exceptional $55,571 |
| Immigrants | Vietnam | 100.0 /100 | #48 | Exceptional $55,562 |
| Iranians | 100.0 /100 | #49 | Exceptional $55,548 |
| Puget Sound Salish | 100.0 /100 | #50 | Exceptional $55,543 |
| Immigrants | Romania | 100.0 /100 | #51 | Exceptional $55,522 |
Demographics Similar to Immigrants from Sweden by Householder Income Under 25 years
In terms of householder income under 25 years, the demographic groups most similar to Immigrants from Sweden are Romanian ($53,632, a difference of 0.020%), Immigrants from Albania ($53,597, a difference of 0.040%), Immigrants from Oceania ($53,680, a difference of 0.11%), Immigrants from Spain ($53,560, a difference of 0.11%), and Lithuanian ($53,552, a difference of 0.13%).
| Demographics | Rating | Rank | Householder Income Under 25 years |
| Australians | 97.8 /100 | #107 | Exceptional $53,739 |
| Maltese | 97.8 /100 | #108 | Exceptional $53,735 |
| Immigrants | Ecuador | 97.7 /100 | #109 | Exceptional $53,722 |
| Greeks | 97.7 /100 | #110 | Exceptional $53,715 |
| Immigrants | Colombia | 97.7 /100 | #111 | Exceptional $53,714 |
| Immigrants | Oceania | 97.5 /100 | #112 | Exceptional $53,680 |
| Romanians | 97.2 /100 | #113 | Exceptional $53,632 |
| Immigrants | Sweden | 97.1 /100 | #114 | Exceptional $53,621 |
| Immigrants | Albania | 96.9 /100 | #115 | Exceptional $53,597 |
| Immigrants | Spain | 96.6 /100 | #116 | Exceptional $53,560 |
| Lithuanians | 96.6 /100 | #117 | Exceptional $53,552 |
| Immigrants | Switzerland | 96.3 /100 | #118 | Exceptional $53,528 |
| Italians | 95.4 /100 | #119 | Exceptional $53,426 |
| Guamanians/Chamorros | 95.3 /100 | #120 | Exceptional $53,423 |
| Immigrants | Canada | 95.2 /100 | #121 | Exceptional $53,411 |