Paraguayan vs Iroquois In Labor Force | Age 45-54
COMPARE
Paraguayan
Iroquois
In Labor Force | Age 45-54
In Labor Force | Age 45-54 Comparison
Paraguayans
Iroquois
83.5%
IN LABOR FORCE | AGE 45-54
98.5/ 100
METRIC RATING
57th/ 347
METRIC RANK
80.6%
IN LABOR FORCE | AGE 45-54
0.0/ 100
METRIC RATING
292nd/ 347
METRIC RANK
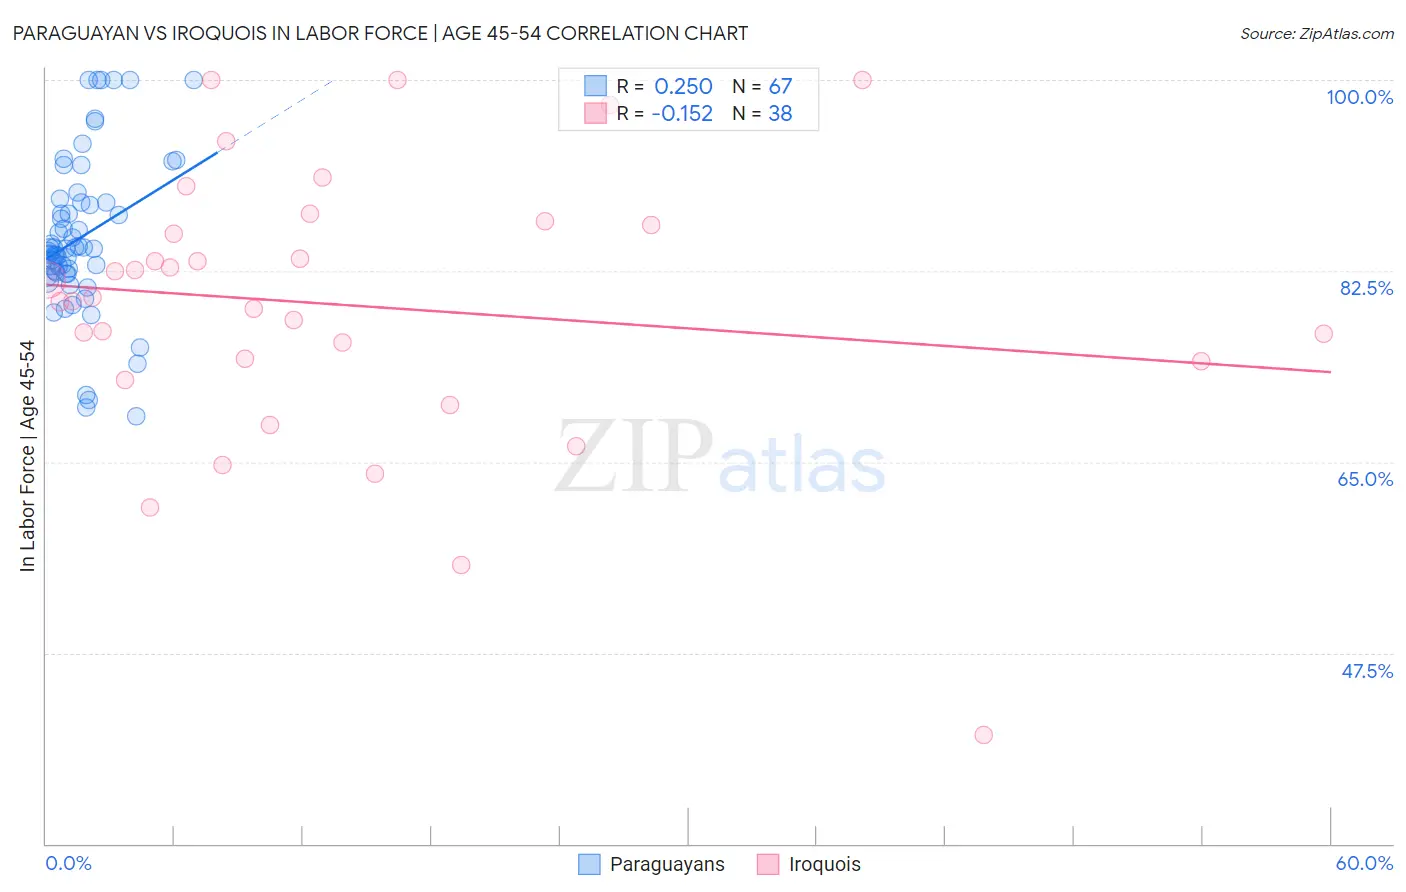
Paraguayan vs Iroquois In Labor Force | Age 45-54 Correlation Chart
The statistical analysis conducted on geographies consisting of 95,100,902 people shows a weak positive correlation between the proportion of Paraguayans and labor force participation rate among population between the ages 45 and 54 in the United States with a correlation coefficient (R) of 0.250 and weighted average of 83.5%. Similarly, the statistical analysis conducted on geographies consisting of 207,246,780 people shows a poor negative correlation between the proportion of Iroquois and labor force participation rate among population between the ages 45 and 54 in the United States with a correlation coefficient (R) of -0.152 and weighted average of 80.6%, a difference of 3.6%.
In Labor Force | Age 45-54 Correlation Summary
| Measurement | Paraguayan | Iroquois |
| Minimum | 69.2% | 40.0% |
| Maximum | 100.0% | 100.0% |
| Range | 30.8% | 60.0% |
| Mean | 85.6% | 79.3% |
| Median | 84.5% | 79.9% |
| Interquartile 25% (IQ1) | 82.2% | 74.2% |
| Interquartile 75% (IQ3) | 88.8% | 86.7% |
| Interquartile Range (IQR) | 6.6% | 12.5% |
| Standard Deviation (Sample) | 7.2% | 12.6% |
| Standard Deviation (Population) | 7.2% | 12.4% |
Similar Demographics by In Labor Force | Age 45-54
Demographics Similar to Paraguayans by In Labor Force | Age 45-54
In terms of in labor force | age 45-54, the demographic groups most similar to Paraguayans are Immigrants from Peru (83.5%, a difference of 0.010%), Eastern European (83.5%, a difference of 0.010%), Macedonian (83.5%, a difference of 0.020%), Somali (83.5%, a difference of 0.030%), and Bhutanese (83.5%, a difference of 0.030%).
| Demographics | Rating | Rank | In Labor Force | Age 45-54 |
| Immigrants | Greece | 98.8 /100 | #50 | Exceptional 83.6% |
| Immigrants | Turkey | 98.8 /100 | #51 | Exceptional 83.6% |
| Poles | 98.7 /100 | #52 | Exceptional 83.6% |
| Peruvians | 98.7 /100 | #53 | Exceptional 83.6% |
| Somalis | 98.7 /100 | #54 | Exceptional 83.5% |
| Macedonians | 98.7 /100 | #55 | Exceptional 83.5% |
| Immigrants | Peru | 98.6 /100 | #56 | Exceptional 83.5% |
| Paraguayans | 98.5 /100 | #57 | Exceptional 83.5% |
| Eastern Europeans | 98.5 /100 | #58 | Exceptional 83.5% |
| Bhutanese | 98.3 /100 | #59 | Exceptional 83.5% |
| Carpatho Rusyns | 98.3 /100 | #60 | Exceptional 83.5% |
| Filipinos | 98.3 /100 | #61 | Exceptional 83.5% |
| Immigrants | Taiwan | 98.0 /100 | #62 | Exceptional 83.5% |
| Afghans | 97.9 /100 | #63 | Exceptional 83.5% |
| Immigrants | Kenya | 97.9 /100 | #64 | Exceptional 83.5% |
Demographics Similar to Iroquois by In Labor Force | Age 45-54
In terms of in labor force | age 45-54, the demographic groups most similar to Iroquois are Osage (80.6%, a difference of 0.020%), Yakama (80.6%, a difference of 0.020%), Immigrants from Belize (80.6%, a difference of 0.030%), Nepalese (80.5%, a difference of 0.090%), and African (80.5%, a difference of 0.12%).
| Demographics | Rating | Rank | In Labor Force | Age 45-54 |
| Delaware | 0.0 /100 | #285 | Tragic 80.8% |
| Immigrants | Dominica | 0.0 /100 | #286 | Tragic 80.8% |
| Vietnamese | 0.0 /100 | #287 | Tragic 80.8% |
| Cree | 0.0 /100 | #288 | Tragic 80.8% |
| Immigrants | Bangladesh | 0.0 /100 | #289 | Tragic 80.7% |
| Mexican American Indians | 0.0 /100 | #290 | Tragic 80.7% |
| Immigrants | Belize | 0.0 /100 | #291 | Tragic 80.6% |
| Iroquois | 0.0 /100 | #292 | Tragic 80.6% |
| Osage | 0.0 /100 | #293 | Tragic 80.6% |
| Yakama | 0.0 /100 | #294 | Tragic 80.6% |
| Nepalese | 0.0 /100 | #295 | Tragic 80.5% |
| Africans | 0.0 /100 | #296 | Tragic 80.5% |
| Americans | 0.0 /100 | #297 | Tragic 80.4% |
| Marshallese | 0.0 /100 | #298 | Tragic 80.3% |
| Dominicans | 0.0 /100 | #299 | Tragic 80.3% |