Paraguayan vs Brazilian In Labor Force | Age 45-54
COMPARE
Paraguayan
Brazilian
In Labor Force | Age 45-54
In Labor Force | Age 45-54 Comparison
Paraguayans
Brazilians
83.5%
IN LABOR FORCE | AGE 45-54
98.5/ 100
METRIC RATING
57th/ 347
METRIC RANK
83.7%
IN LABOR FORCE | AGE 45-54
99.5/ 100
METRIC RATING
35th/ 347
METRIC RANK
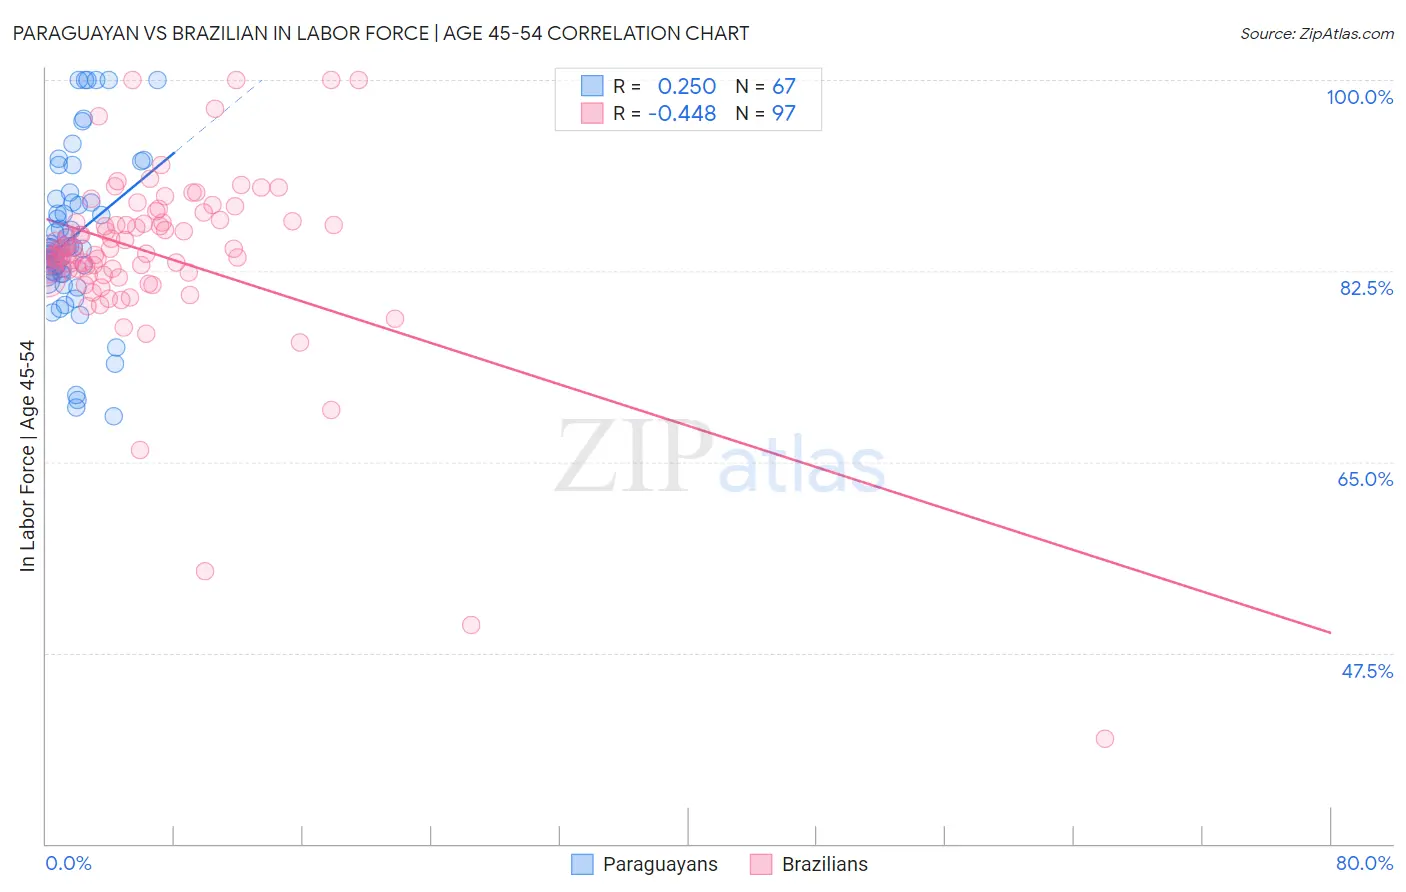
Paraguayan vs Brazilian In Labor Force | Age 45-54 Correlation Chart
The statistical analysis conducted on geographies consisting of 95,100,902 people shows a weak positive correlation between the proportion of Paraguayans and labor force participation rate among population between the ages 45 and 54 in the United States with a correlation coefficient (R) of 0.250 and weighted average of 83.5%. Similarly, the statistical analysis conducted on geographies consisting of 323,713,941 people shows a moderate negative correlation between the proportion of Brazilians and labor force participation rate among population between the ages 45 and 54 in the United States with a correlation coefficient (R) of -0.448 and weighted average of 83.7%, a difference of 0.23%.
In Labor Force | Age 45-54 Correlation Summary
| Measurement | Paraguayan | Brazilian |
| Minimum | 69.2% | 39.6% |
| Maximum | 100.0% | 100.0% |
| Range | 30.8% | 60.4% |
| Mean | 85.6% | 84.0% |
| Median | 84.5% | 84.5% |
| Interquartile 25% (IQ1) | 82.2% | 82.3% |
| Interquartile 75% (IQ3) | 88.8% | 87.1% |
| Interquartile Range (IQR) | 6.6% | 4.8% |
| Standard Deviation (Sample) | 7.2% | 8.5% |
| Standard Deviation (Population) | 7.2% | 8.4% |
Similar Demographics by In Labor Force | Age 45-54
Demographics Similar to Paraguayans by In Labor Force | Age 45-54
In terms of in labor force | age 45-54, the demographic groups most similar to Paraguayans are Immigrants from Peru (83.5%, a difference of 0.010%), Eastern European (83.5%, a difference of 0.010%), Macedonian (83.5%, a difference of 0.020%), Somali (83.5%, a difference of 0.030%), and Bhutanese (83.5%, a difference of 0.030%).
| Demographics | Rating | Rank | In Labor Force | Age 45-54 |
| Immigrants | Greece | 98.8 /100 | #50 | Exceptional 83.6% |
| Immigrants | Turkey | 98.8 /100 | #51 | Exceptional 83.6% |
| Poles | 98.7 /100 | #52 | Exceptional 83.6% |
| Peruvians | 98.7 /100 | #53 | Exceptional 83.6% |
| Somalis | 98.7 /100 | #54 | Exceptional 83.5% |
| Macedonians | 98.7 /100 | #55 | Exceptional 83.5% |
| Immigrants | Peru | 98.6 /100 | #56 | Exceptional 83.5% |
| Paraguayans | 98.5 /100 | #57 | Exceptional 83.5% |
| Eastern Europeans | 98.5 /100 | #58 | Exceptional 83.5% |
| Bhutanese | 98.3 /100 | #59 | Exceptional 83.5% |
| Carpatho Rusyns | 98.3 /100 | #60 | Exceptional 83.5% |
| Filipinos | 98.3 /100 | #61 | Exceptional 83.5% |
| Immigrants | Taiwan | 98.0 /100 | #62 | Exceptional 83.5% |
| Afghans | 97.9 /100 | #63 | Exceptional 83.5% |
| Immigrants | Kenya | 97.9 /100 | #64 | Exceptional 83.5% |
Demographics Similar to Brazilians by In Labor Force | Age 45-54
In terms of in labor force | age 45-54, the demographic groups most similar to Brazilians are Kenyan (83.7%, a difference of 0.0%), Ugandan (83.7%, a difference of 0.0%), Swedish (83.7%, a difference of 0.030%), Immigrants from Venezuela (83.7%, a difference of 0.040%), and Immigrants from Cuba (83.7%, a difference of 0.040%).
| Demographics | Rating | Rank | In Labor Force | Age 45-54 |
| Immigrants | Lithuania | 99.8 /100 | #28 | Exceptional 83.9% |
| Immigrants | Pakistan | 99.7 /100 | #29 | Exceptional 83.8% |
| Immigrants | Bulgaria | 99.7 /100 | #30 | Exceptional 83.8% |
| Immigrants | Eritrea | 99.7 /100 | #31 | Exceptional 83.8% |
| Turks | 99.7 /100 | #32 | Exceptional 83.8% |
| Latvians | 99.7 /100 | #33 | Exceptional 83.8% |
| Kenyans | 99.5 /100 | #34 | Exceptional 83.7% |
| Brazilians | 99.5 /100 | #35 | Exceptional 83.7% |
| Ugandans | 99.5 /100 | #36 | Exceptional 83.7% |
| Swedes | 99.4 /100 | #37 | Exceptional 83.7% |
| Immigrants | Venezuela | 99.4 /100 | #38 | Exceptional 83.7% |
| Immigrants | Cuba | 99.4 /100 | #39 | Exceptional 83.7% |
| Immigrants | Uganda | 99.4 /100 | #40 | Exceptional 83.7% |
| Immigrants | Korea | 99.3 /100 | #41 | Exceptional 83.7% |
| Immigrants | Moldova | 99.3 /100 | #42 | Exceptional 83.7% |