Immigrants from Poland vs Puget Sound Salish In Labor Force | Age 25-29
COMPARE
Immigrants from Poland
Puget Sound Salish
In Labor Force | Age 25-29
In Labor Force | Age 25-29 Comparison
Immigrants from Poland
Puget Sound Salish
85.6%
IN LABOR FORCE | AGE 25-29
99.7/ 100
METRIC RATING
52nd/ 347
METRIC RANK
83.5%
IN LABOR FORCE | AGE 25-29
0.1/ 100
METRIC RATING
264th/ 347
METRIC RANK
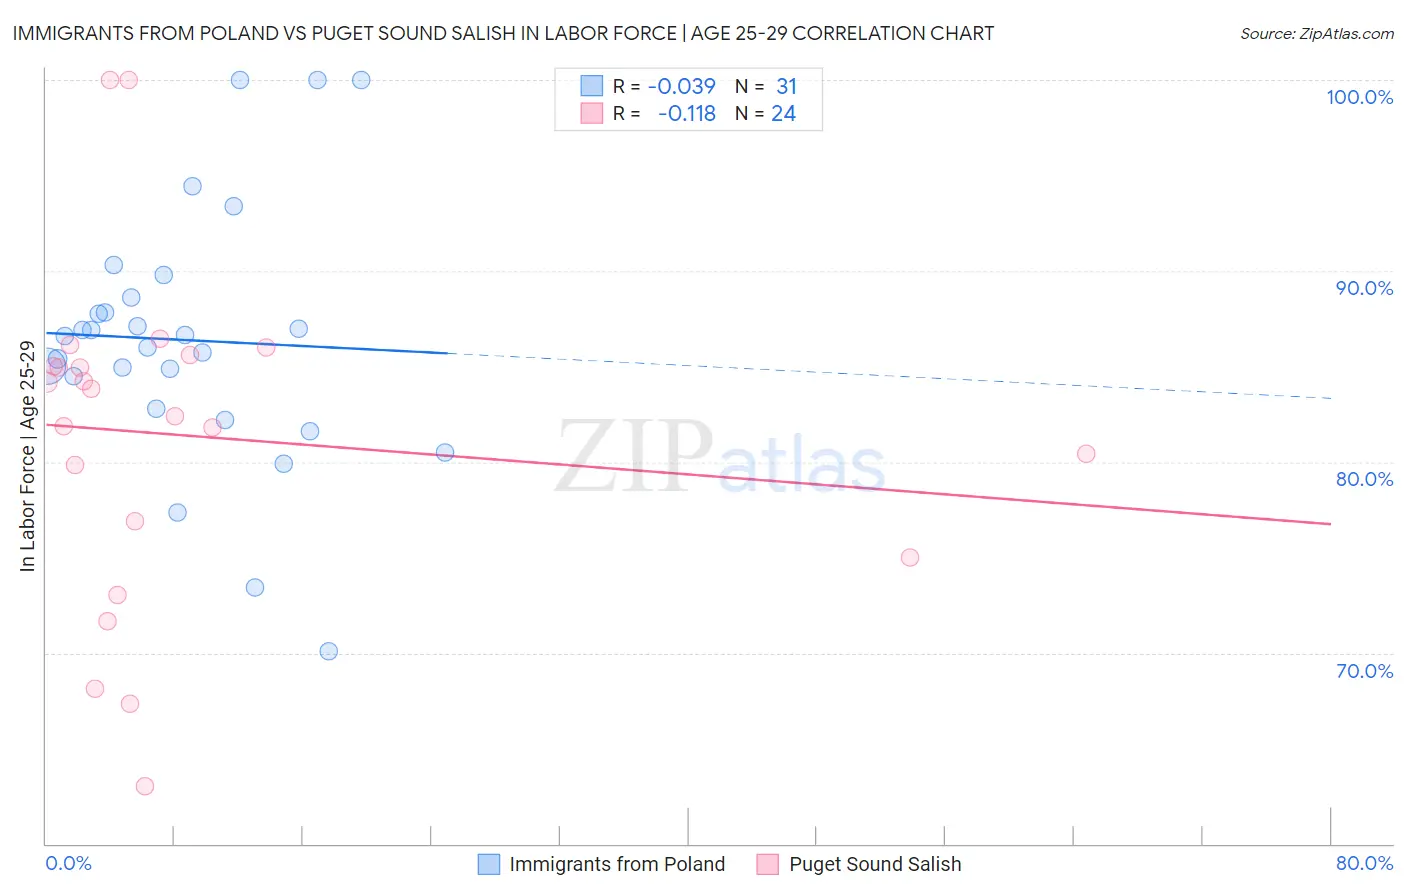
Immigrants from Poland vs Puget Sound Salish In Labor Force | Age 25-29 Correlation Chart
The statistical analysis conducted on geographies consisting of 304,774,487 people shows no correlation between the proportion of Immigrants from Poland and labor force participation rate among population between the ages 25 and 29 in the United States with a correlation coefficient (R) of -0.039 and weighted average of 85.6%. Similarly, the statistical analysis conducted on geographies consisting of 46,150,488 people shows a poor negative correlation between the proportion of Puget Sound Salish and labor force participation rate among population between the ages 25 and 29 in the United States with a correlation coefficient (R) of -0.118 and weighted average of 83.5%, a difference of 2.5%.
In Labor Force | Age 25-29 Correlation Summary
| Measurement | Immigrants from Poland | Puget Sound Salish |
| Minimum | 70.1% | 63.0% |
| Maximum | 100.0% | 100.0% |
| Range | 29.9% | 37.0% |
| Mean | 86.4% | 81.4% |
| Median | 86.6% | 83.1% |
| Interquartile 25% (IQ1) | 82.8% | 76.0% |
| Interquartile 75% (IQ3) | 88.6% | 85.3% |
| Interquartile Range (IQR) | 5.8% | 9.4% |
| Standard Deviation (Sample) | 6.7% | 8.8% |
| Standard Deviation (Population) | 6.6% | 8.6% |
Similar Demographics by In Labor Force | Age 25-29
Demographics Similar to Immigrants from Poland by In Labor Force | Age 25-29
In terms of in labor force | age 25-29, the demographic groups most similar to Immigrants from Poland are Immigrants from Latvia (85.6%, a difference of 0.020%), Yugoslavian (85.6%, a difference of 0.030%), Belgian (85.5%, a difference of 0.030%), Albanian (85.5%, a difference of 0.030%), and Immigrants from Brazil (85.5%, a difference of 0.040%).
| Demographics | Rating | Rank | In Labor Force | Age 25-29 |
| Immigrants | Sierra Leone | 99.9 /100 | #45 | Exceptional 85.7% |
| Czechs | 99.8 /100 | #46 | Exceptional 85.6% |
| Turks | 99.8 /100 | #47 | Exceptional 85.6% |
| Italians | 99.8 /100 | #48 | Exceptional 85.6% |
| Swedes | 99.8 /100 | #49 | Exceptional 85.6% |
| Yugoslavians | 99.8 /100 | #50 | Exceptional 85.6% |
| Immigrants | Latvia | 99.8 /100 | #51 | Exceptional 85.6% |
| Immigrants | Poland | 99.7 /100 | #52 | Exceptional 85.6% |
| Belgians | 99.7 /100 | #53 | Exceptional 85.5% |
| Albanians | 99.7 /100 | #54 | Exceptional 85.5% |
| Immigrants | Brazil | 99.7 /100 | #55 | Exceptional 85.5% |
| Eastern Europeans | 99.6 /100 | #56 | Exceptional 85.5% |
| Estonians | 99.6 /100 | #57 | Exceptional 85.5% |
| Greeks | 99.6 /100 | #58 | Exceptional 85.5% |
| Immigrants | Morocco | 99.5 /100 | #59 | Exceptional 85.5% |
Demographics Similar to Puget Sound Salish by In Labor Force | Age 25-29
In terms of in labor force | age 25-29, the demographic groups most similar to Puget Sound Salish are Cuban (83.5%, a difference of 0.0%), Aleut (83.4%, a difference of 0.040%), Spanish American (83.4%, a difference of 0.050%), West Indian (83.5%, a difference of 0.060%), and Immigrants from Lebanon (83.4%, a difference of 0.060%).
| Demographics | Rating | Rank | In Labor Force | Age 25-29 |
| Delaware | 0.2 /100 | #257 | Tragic 83.7% |
| Immigrants | Guatemala | 0.1 /100 | #258 | Tragic 83.6% |
| Spanish | 0.1 /100 | #259 | Tragic 83.6% |
| Immigrants | Bahamas | 0.1 /100 | #260 | Tragic 83.6% |
| Pennsylvania Germans | 0.1 /100 | #261 | Tragic 83.6% |
| Immigrants | Fiji | 0.1 /100 | #262 | Tragic 83.6% |
| West Indians | 0.1 /100 | #263 | Tragic 83.5% |
| Puget Sound Salish | 0.1 /100 | #264 | Tragic 83.5% |
| Cubans | 0.1 /100 | #265 | Tragic 83.5% |
| Aleuts | 0.0 /100 | #266 | Tragic 83.4% |
| Spanish Americans | 0.0 /100 | #267 | Tragic 83.4% |
| Immigrants | Lebanon | 0.0 /100 | #268 | Tragic 83.4% |
| Immigrants | Barbados | 0.0 /100 | #269 | Tragic 83.4% |
| Basques | 0.0 /100 | #270 | Tragic 83.4% |
| Hondurans | 0.0 /100 | #271 | Tragic 83.4% |