Immigrants from Belize vs Immigrants from Norway In Labor Force | Age 45-54
COMPARE
Immigrants from Belize
Immigrants from Norway
In Labor Force | Age 45-54
In Labor Force | Age 45-54 Comparison
Immigrants from Belize
Immigrants from Norway
80.6%
IN LABOR FORCE | AGE 45-54
0.0/ 100
METRIC RATING
291st/ 347
METRIC RANK
82.5%
IN LABOR FORCE | AGE 45-54
20.7/ 100
METRIC RATING
194th/ 347
METRIC RANK
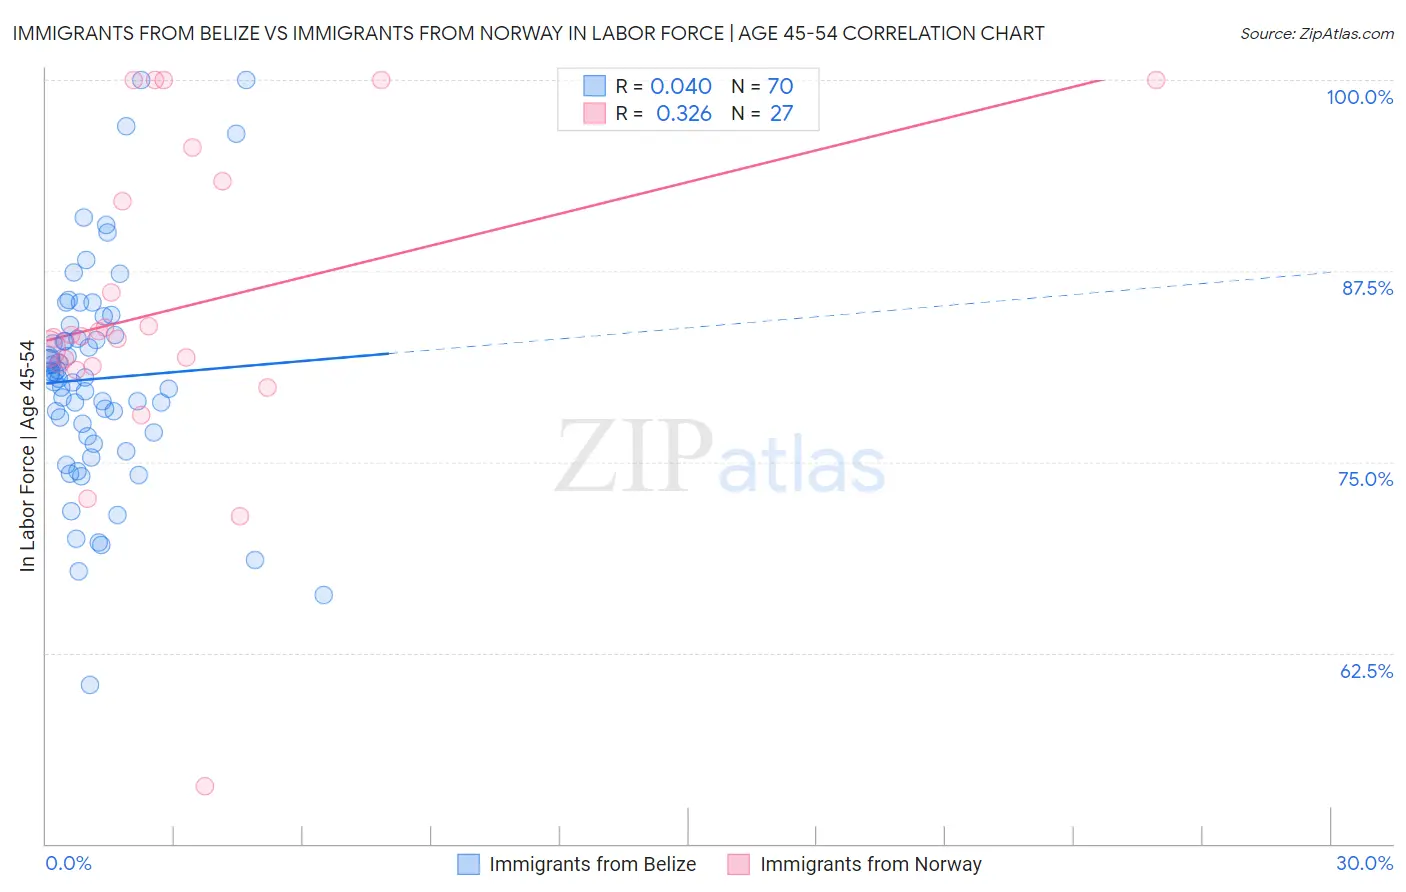
Immigrants from Belize vs Immigrants from Norway In Labor Force | Age 45-54 Correlation Chart
The statistical analysis conducted on geographies consisting of 130,298,014 people shows no correlation between the proportion of Immigrants from Belize and labor force participation rate among population between the ages 45 and 54 in the United States with a correlation coefficient (R) of 0.040 and weighted average of 80.6%. Similarly, the statistical analysis conducted on geographies consisting of 116,685,095 people shows a mild positive correlation between the proportion of Immigrants from Norway and labor force participation rate among population between the ages 45 and 54 in the United States with a correlation coefficient (R) of 0.326 and weighted average of 82.5%, a difference of 2.3%.
In Labor Force | Age 45-54 Correlation Summary
| Measurement | Immigrants from Belize | Immigrants from Norway |
| Minimum | 60.4% | 53.8% |
| Maximum | 100.0% | 100.0% |
| Range | 39.6% | 46.2% |
| Mean | 80.4% | 85.1% |
| Median | 80.5% | 83.2% |
| Interquartile 25% (IQ1) | 76.7% | 81.3% |
| Interquartile 75% (IQ3) | 83.3% | 93.4% |
| Interquartile Range (IQR) | 6.6% | 12.1% |
| Standard Deviation (Sample) | 7.3% | 10.4% |
| Standard Deviation (Population) | 7.2% | 10.2% |
Similar Demographics by In Labor Force | Age 45-54
Demographics Similar to Immigrants from Belize by In Labor Force | Age 45-54
In terms of in labor force | age 45-54, the demographic groups most similar to Immigrants from Belize are Iroquois (80.6%, a difference of 0.030%), Osage (80.6%, a difference of 0.050%), Yakama (80.6%, a difference of 0.050%), Mexican American Indian (80.7%, a difference of 0.10%), and Nepalese (80.5%, a difference of 0.12%).
| Demographics | Rating | Rank | In Labor Force | Age 45-54 |
| Belizeans | 0.0 /100 | #284 | Tragic 80.8% |
| Delaware | 0.0 /100 | #285 | Tragic 80.8% |
| Immigrants | Dominica | 0.0 /100 | #286 | Tragic 80.8% |
| Vietnamese | 0.0 /100 | #287 | Tragic 80.8% |
| Cree | 0.0 /100 | #288 | Tragic 80.8% |
| Immigrants | Bangladesh | 0.0 /100 | #289 | Tragic 80.7% |
| Mexican American Indians | 0.0 /100 | #290 | Tragic 80.7% |
| Immigrants | Belize | 0.0 /100 | #291 | Tragic 80.6% |
| Iroquois | 0.0 /100 | #292 | Tragic 80.6% |
| Osage | 0.0 /100 | #293 | Tragic 80.6% |
| Yakama | 0.0 /100 | #294 | Tragic 80.6% |
| Nepalese | 0.0 /100 | #295 | Tragic 80.5% |
| Africans | 0.0 /100 | #296 | Tragic 80.5% |
| Americans | 0.0 /100 | #297 | Tragic 80.4% |
| Marshallese | 0.0 /100 | #298 | Tragic 80.3% |
Demographics Similar to Immigrants from Norway by In Labor Force | Age 45-54
In terms of in labor force | age 45-54, the demographic groups most similar to Immigrants from Norway are Immigrants from Iraq (82.5%, a difference of 0.0%), Australian (82.5%, a difference of 0.0%), Immigrants from Canada (82.5%, a difference of 0.010%), Armenian (82.5%, a difference of 0.030%), and Immigrants from North America (82.5%, a difference of 0.030%).
| Demographics | Rating | Rank | In Labor Force | Age 45-54 |
| Immigrants | Costa Rica | 28.3 /100 | #187 | Fair 82.6% |
| South Africans | 28.0 /100 | #188 | Fair 82.6% |
| Syrians | 26.0 /100 | #189 | Fair 82.6% |
| British | 25.7 /100 | #190 | Fair 82.6% |
| Armenians | 23.2 /100 | #191 | Fair 82.5% |
| Immigrants | Iraq | 20.9 /100 | #192 | Fair 82.5% |
| Australians | 20.8 /100 | #193 | Fair 82.5% |
| Immigrants | Norway | 20.7 /100 | #194 | Fair 82.5% |
| Immigrants | Canada | 20.0 /100 | #195 | Fair 82.5% |
| Immigrants | North America | 18.8 /100 | #196 | Poor 82.5% |
| Lebanese | 18.2 /100 | #197 | Poor 82.5% |
| Immigrants | Denmark | 17.9 /100 | #198 | Poor 82.5% |
| Moroccans | 15.7 /100 | #199 | Poor 82.5% |
| French Canadians | 15.4 /100 | #200 | Poor 82.5% |
| Canadians | 15.1 /100 | #201 | Poor 82.4% |