Pakistani vs Danish In Labor Force | Age 20-64
COMPARE
Pakistani
Danish
In Labor Force | Age 20-64
In Labor Force | Age 20-64 Comparison
Pakistanis
Danes
79.8%
IN LABOR FORCE | AGE 20-64
79.3/ 100
METRIC RATING
145th/ 347
METRIC RANK
79.9%
IN LABOR FORCE | AGE 20-64
91.5/ 100
METRIC RATING
125th/ 347
METRIC RANK
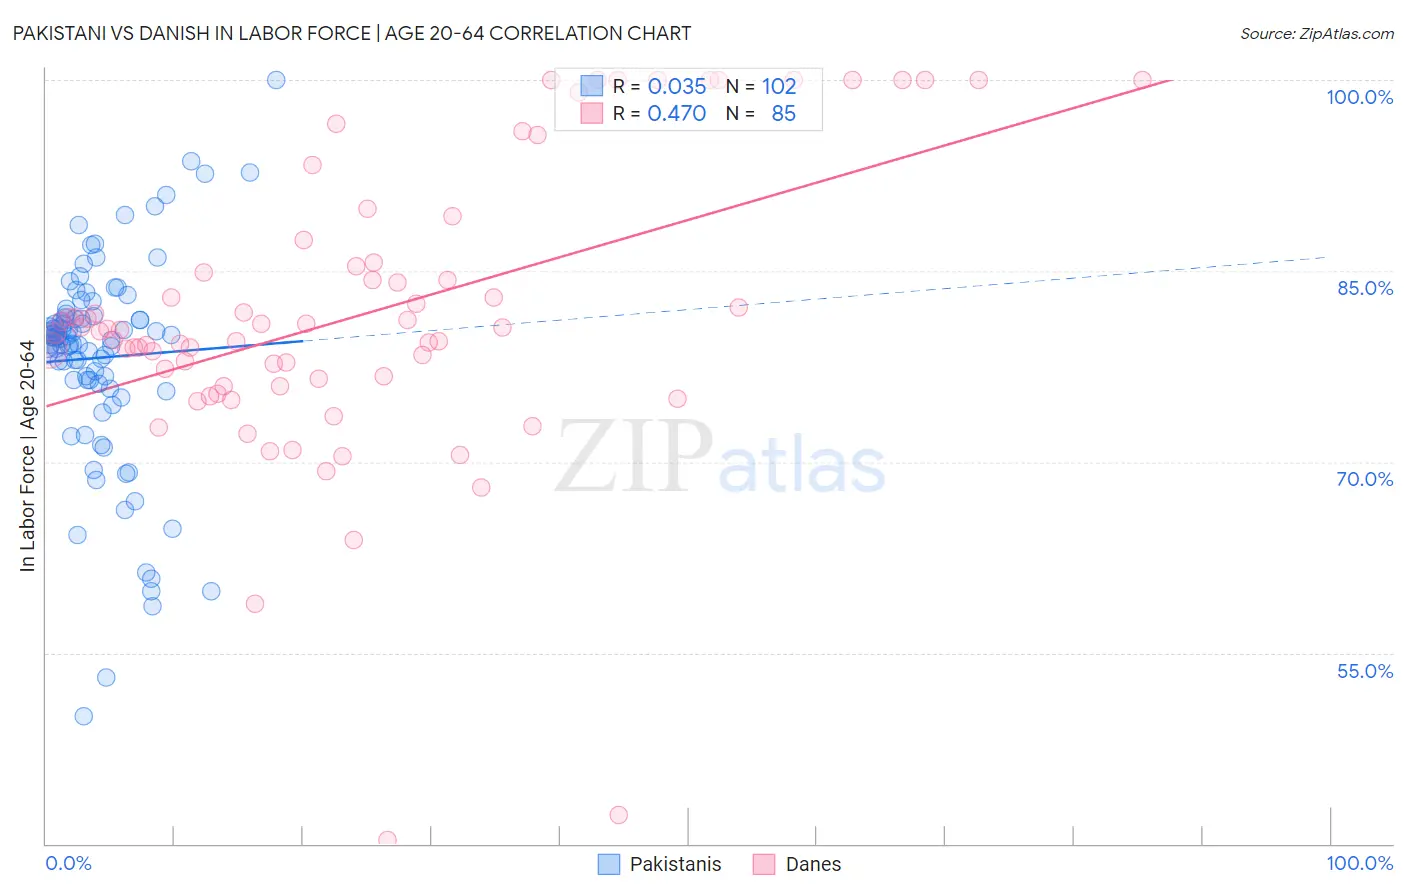
Pakistani vs Danish In Labor Force | Age 20-64 Correlation Chart
The statistical analysis conducted on geographies consisting of 335,365,372 people shows no correlation between the proportion of Pakistanis and labor force participation rate among population between the ages 20 and 64 in the United States with a correlation coefficient (R) of 0.035 and weighted average of 79.8%. Similarly, the statistical analysis conducted on geographies consisting of 474,188,887 people shows a moderate positive correlation between the proportion of Danes and labor force participation rate among population between the ages 20 and 64 in the United States with a correlation coefficient (R) of 0.470 and weighted average of 79.9%, a difference of 0.21%.
In Labor Force | Age 20-64 Correlation Summary
| Measurement | Pakistani | Danish |
| Minimum | 50.0% | 40.3% |
| Maximum | 100.0% | 100.0% |
| Range | 50.0% | 59.7% |
| Mean | 78.2% | 81.6% |
| Median | 79.8% | 80.4% |
| Interquartile 25% (IQ1) | 76.4% | 76.2% |
| Interquartile 75% (IQ3) | 81.4% | 85.5% |
| Interquartile Range (IQR) | 5.0% | 9.3% |
| Standard Deviation (Sample) | 8.2% | 11.5% |
| Standard Deviation (Population) | 8.1% | 11.4% |
Demographics Similar to Pakistanis and Danes by In Labor Force | Age 20-64
In terms of in labor force | age 20-64, the demographic groups most similar to Pakistanis are Korean (79.8%, a difference of 0.0%), Immigrants from South Eastern Asia (79.8%, a difference of 0.010%), Immigrants from Israel (79.8%, a difference of 0.010%), Slovak (79.8%, a difference of 0.010%), and Immigrants from Sweden (79.8%, a difference of 0.010%). Similarly, the demographic groups most similar to Danes are Immigrants from France (79.9%, a difference of 0.020%), Immigrants from Czechoslovakia (79.9%, a difference of 0.040%), Immigrants from Eastern Asia (79.9%, a difference of 0.050%), Italian (79.9%, a difference of 0.060%), and Immigrants from Zaire (79.9%, a difference of 0.070%).
| Demographics | Rating | Rank | In Labor Force | Age 20-64 |
| Danes | 91.5 /100 | #125 | Exceptional 79.9% |
| Immigrants | France | 90.7 /100 | #126 | Exceptional 79.9% |
| Immigrants | Czechoslovakia | 89.7 /100 | #127 | Excellent 79.9% |
| Immigrants | Eastern Asia | 89.4 /100 | #128 | Excellent 79.9% |
| Italians | 88.9 /100 | #129 | Excellent 79.9% |
| Immigrants | Zaire | 88.6 /100 | #130 | Excellent 79.9% |
| Immigrants | Iran | 88.3 /100 | #131 | Excellent 79.9% |
| Indians (Asian) | 87.7 /100 | #132 | Excellent 79.9% |
| South American Indians | 87.6 /100 | #133 | Excellent 79.9% |
| Belgians | 87.4 /100 | #134 | Excellent 79.9% |
| Ukrainians | 86.8 /100 | #135 | Excellent 79.9% |
| Immigrants | Singapore | 86.7 /100 | #136 | Excellent 79.9% |
| Immigrants | Ukraine | 86.5 /100 | #137 | Excellent 79.9% |
| Immigrants | Nigeria | 86.4 /100 | #138 | Excellent 79.9% |
| Immigrants | Spain | 83.9 /100 | #139 | Excellent 79.8% |
| Immigrants | South Eastern Asia | 80.4 /100 | #140 | Excellent 79.8% |
| Immigrants | Israel | 80.0 /100 | #141 | Good 79.8% |
| Slovaks | 79.9 /100 | #142 | Good 79.8% |
| Immigrants | Sweden | 79.7 /100 | #143 | Good 79.8% |
| Koreans | 79.6 /100 | #144 | Good 79.8% |
| Pakistanis | 79.3 /100 | #145 | Good 79.8% |