Paiute vs Czechoslovakian In Labor Force | Age 45-54
COMPARE
Paiute
Czechoslovakian
In Labor Force | Age 45-54
In Labor Force | Age 45-54 Comparison
Paiute
Czechoslovakians
76.7%
IN LABOR FORCE | AGE 45-54
0.0/ 100
METRIC RATING
336th/ 347
METRIC RANK
83.0%
IN LABOR FORCE | AGE 45-54
74.8/ 100
METRIC RATING
147th/ 347
METRIC RANK
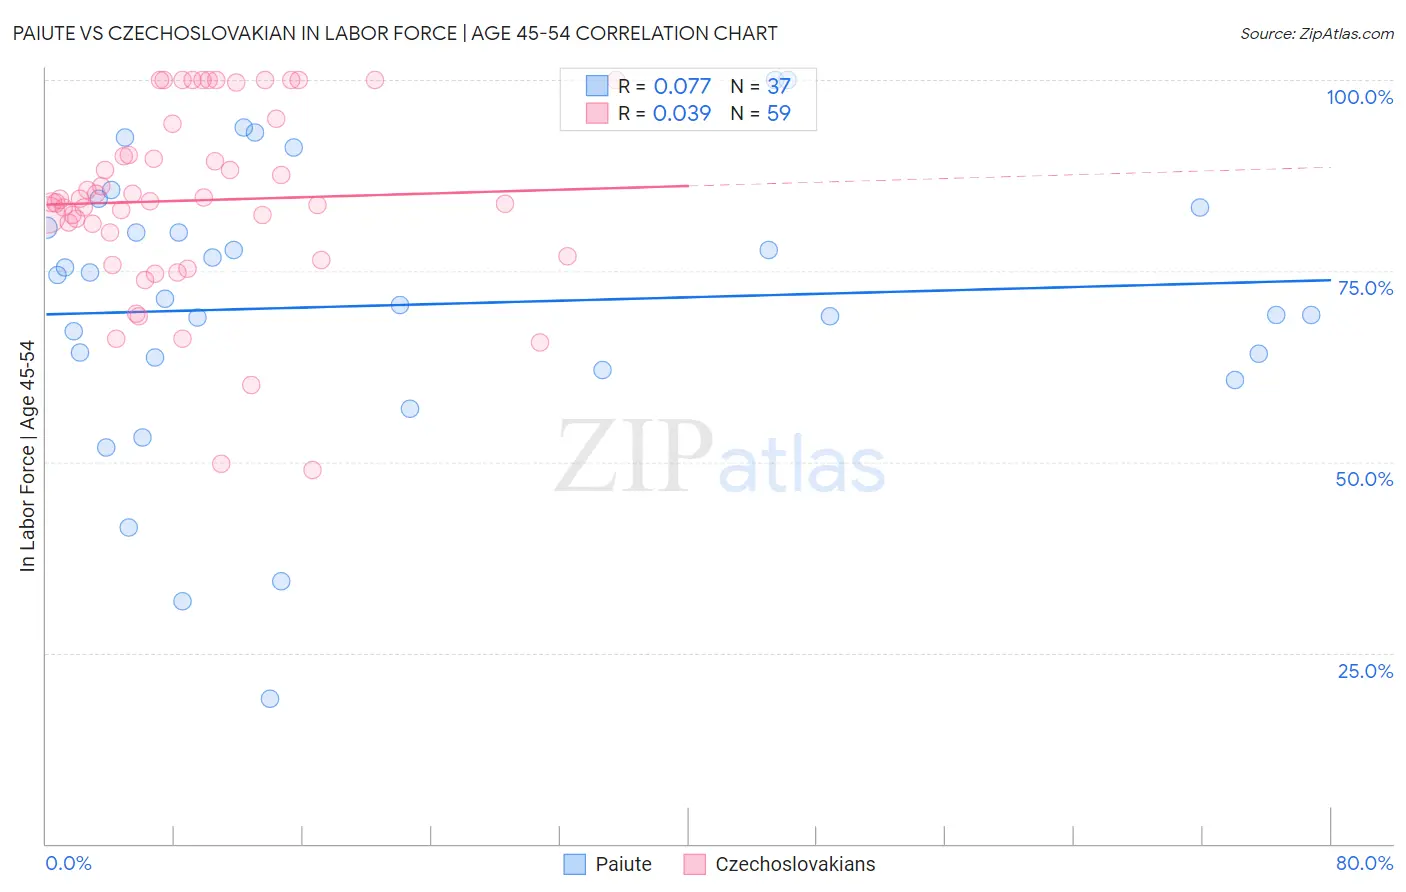
Paiute vs Czechoslovakian In Labor Force | Age 45-54 Correlation Chart
The statistical analysis conducted on geographies consisting of 58,396,210 people shows a slight positive correlation between the proportion of Paiute and labor force participation rate among population between the ages 45 and 54 in the United States with a correlation coefficient (R) of 0.077 and weighted average of 76.7%. Similarly, the statistical analysis conducted on geographies consisting of 368,521,801 people shows no correlation between the proportion of Czechoslovakians and labor force participation rate among population between the ages 45 and 54 in the United States with a correlation coefficient (R) of 0.039 and weighted average of 83.0%, a difference of 8.2%.
In Labor Force | Age 45-54 Correlation Summary
| Measurement | Paiute | Czechoslovakian |
| Minimum | 19.0% | 48.9% |
| Maximum | 100.0% | 100.0% |
| Range | 81.0% | 51.1% |
| Mean | 70.5% | 84.2% |
| Median | 71.4% | 84.1% |
| Interquartile 25% (IQ1) | 62.9% | 76.9% |
| Interquartile 75% (IQ3) | 82.0% | 94.2% |
| Interquartile Range (IQR) | 19.1% | 17.3% |
| Standard Deviation (Sample) | 18.4% | 12.2% |
| Standard Deviation (Population) | 18.2% | 12.1% |
Similar Demographics by In Labor Force | Age 45-54
Demographics Similar to Paiute by In Labor Force | Age 45-54
In terms of in labor force | age 45-54, the demographic groups most similar to Paiute are Ute (76.6%, a difference of 0.060%), Yuman (76.3%, a difference of 0.47%), Arapaho (77.1%, a difference of 0.54%), Native/Alaskan (77.1%, a difference of 0.61%), and Apache (77.1%, a difference of 0.61%).
| Demographics | Rating | Rank | In Labor Force | Age 45-54 |
| Creek | 0.0 /100 | #329 | Tragic 77.7% |
| Cheyenne | 0.0 /100 | #330 | Tragic 77.6% |
| Tsimshian | 0.0 /100 | #331 | Tragic 77.4% |
| Menominee | 0.0 /100 | #332 | Tragic 77.4% |
| Natives/Alaskans | 0.0 /100 | #333 | Tragic 77.1% |
| Apache | 0.0 /100 | #334 | Tragic 77.1% |
| Arapaho | 0.0 /100 | #335 | Tragic 77.1% |
| Paiute | 0.0 /100 | #336 | Tragic 76.7% |
| Ute | 0.0 /100 | #337 | Tragic 76.6% |
| Yuman | 0.0 /100 | #338 | Tragic 76.3% |
| Puerto Ricans | 0.0 /100 | #339 | Tragic 75.9% |
| Lumbee | 0.0 /100 | #340 | Tragic 75.6% |
| Pueblo | 0.0 /100 | #341 | Tragic 75.5% |
| Tohono O'odham | 0.0 /100 | #342 | Tragic 75.1% |
| Hopi | 0.0 /100 | #343 | Tragic 75.0% |
Demographics Similar to Czechoslovakians by In Labor Force | Age 45-54
In terms of in labor force | age 45-54, the demographic groups most similar to Czechoslovakians are Romanian (83.0%, a difference of 0.010%), Immigrants from France (83.0%, a difference of 0.010%), Immigrants from Nigeria (83.0%, a difference of 0.010%), Soviet Union (83.0%, a difference of 0.020%), and Immigrants from Sweden (82.9%, a difference of 0.020%).
| Demographics | Rating | Rank | In Labor Force | Age 45-54 |
| Yugoslavians | 78.3 /100 | #140 | Good 83.0% |
| Immigrants | Haiti | 77.9 /100 | #141 | Good 83.0% |
| Immigrants | Scotland | 77.8 /100 | #142 | Good 83.0% |
| Okinawans | 77.0 /100 | #143 | Good 83.0% |
| Soviet Union | 76.8 /100 | #144 | Good 83.0% |
| Romanians | 75.4 /100 | #145 | Good 83.0% |
| Immigrants | France | 75.3 /100 | #146 | Good 83.0% |
| Czechoslovakians | 74.8 /100 | #147 | Good 83.0% |
| Immigrants | Nigeria | 74.1 /100 | #148 | Good 83.0% |
| Immigrants | Sweden | 73.3 /100 | #149 | Good 82.9% |
| Immigrants | Netherlands | 72.6 /100 | #150 | Good 82.9% |
| Koreans | 71.9 /100 | #151 | Good 82.9% |
| Slavs | 71.5 /100 | #152 | Good 82.9% |
| Immigrants | Indonesia | 70.6 /100 | #153 | Good 82.9% |
| Immigrants | Ghana | 70.3 /100 | #154 | Good 82.9% |