Osage vs German In Labor Force | Age 30-34
COMPARE
Osage
German
In Labor Force | Age 30-34
In Labor Force | Age 30-34 Comparison
Osage
Germans
82.3%
IN LABOR FORCE | AGE 30-34
0.0/ 100
METRIC RATING
305th/ 347
METRIC RANK
84.8%
IN LABOR FORCE | AGE 30-34
75.1/ 100
METRIC RATING
150th/ 347
METRIC RANK
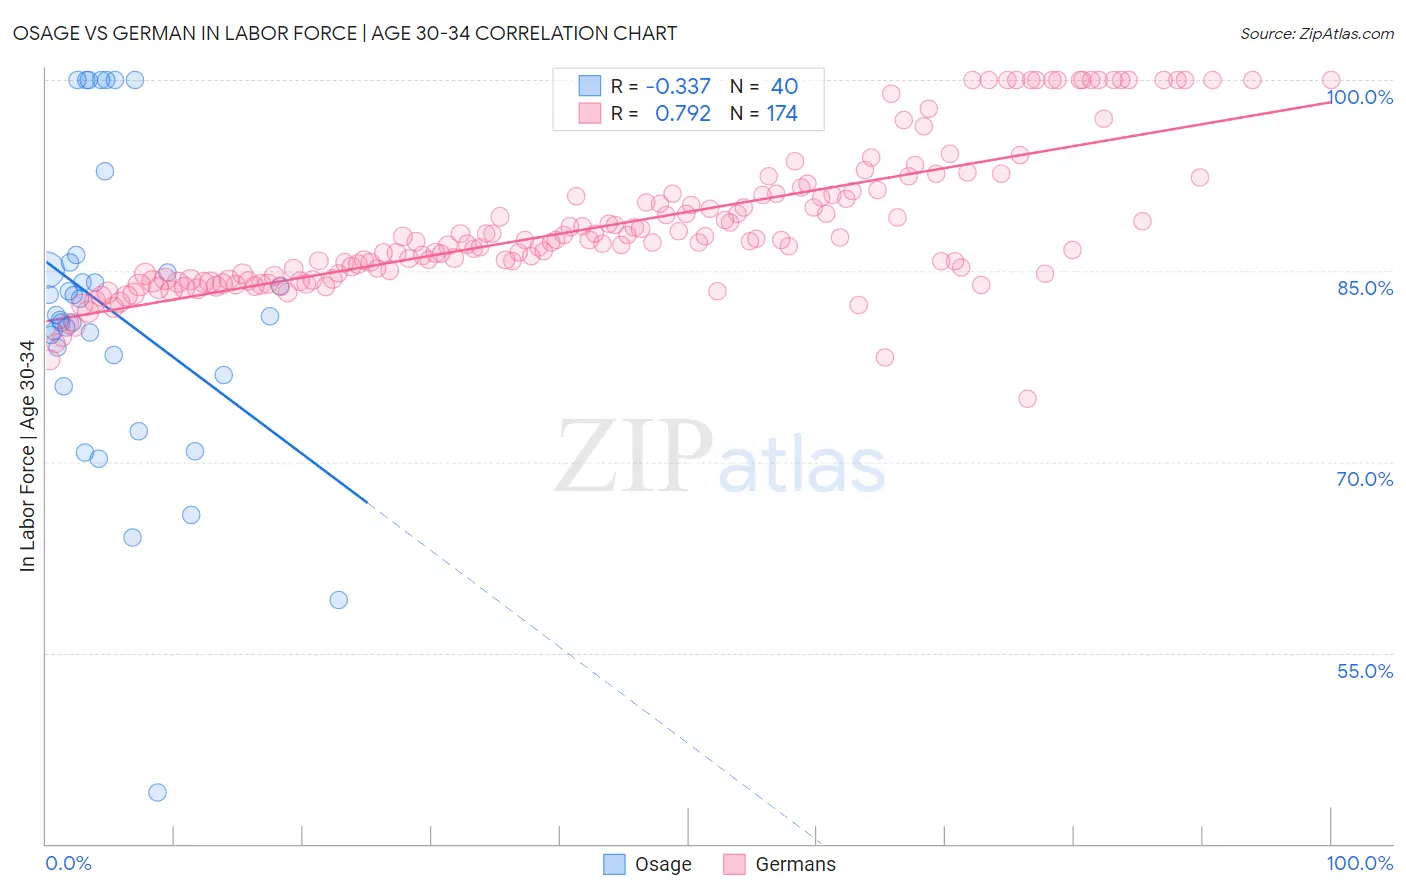
Osage vs German In Labor Force | Age 30-34 Correlation Chart
The statistical analysis conducted on geographies consisting of 91,795,365 people shows a mild negative correlation between the proportion of Osage and labor force participation rate among population between the ages 30 and 34 in the United States with a correlation coefficient (R) of -0.337 and weighted average of 82.3%. Similarly, the statistical analysis conducted on geographies consisting of 579,117,313 people shows a strong positive correlation between the proportion of Germans and labor force participation rate among population between the ages 30 and 34 in the United States with a correlation coefficient (R) of 0.792 and weighted average of 84.8%, a difference of 3.2%.
In Labor Force | Age 30-34 Correlation Summary
| Measurement | Osage | German |
| Minimum | 44.0% | 75.0% |
| Maximum | 100.0% | 100.0% |
| Range | 56.0% | 25.0% |
| Mean | 81.8% | 88.6% |
| Median | 81.5% | 87.3% |
| Interquartile 25% (IQ1) | 77.6% | 84.4% |
| Interquartile 75% (IQ3) | 85.4% | 91.0% |
| Interquartile Range (IQR) | 7.8% | 6.7% |
| Standard Deviation (Sample) | 12.0% | 5.6% |
| Standard Deviation (Population) | 11.8% | 5.6% |
Similar Demographics by In Labor Force | Age 30-34
Demographics Similar to Osage by In Labor Force | Age 30-34
In terms of in labor force | age 30-34, the demographic groups most similar to Osage are Spanish American Indian (82.2%, a difference of 0.020%), Menominee (82.2%, a difference of 0.070%), Tlingit-Haida (82.3%, a difference of 0.080%), Immigrants from Micronesia (82.4%, a difference of 0.16%), and Ottawa (82.4%, a difference of 0.17%).
| Demographics | Rating | Rank | In Labor Force | Age 30-34 |
| Aleuts | 0.0 /100 | #298 | Tragic 82.6% |
| Immigrants | Central America | 0.0 /100 | #299 | Tragic 82.5% |
| Hmong | 0.0 /100 | #300 | Tragic 82.4% |
| Hispanics or Latinos | 0.0 /100 | #301 | Tragic 82.4% |
| Ottawa | 0.0 /100 | #302 | Tragic 82.4% |
| Immigrants | Micronesia | 0.0 /100 | #303 | Tragic 82.4% |
| Tlingit-Haida | 0.0 /100 | #304 | Tragic 82.3% |
| Osage | 0.0 /100 | #305 | Tragic 82.3% |
| Spanish American Indians | 0.0 /100 | #306 | Tragic 82.2% |
| Menominee | 0.0 /100 | #307 | Tragic 82.2% |
| Puget Sound Salish | 0.0 /100 | #308 | Tragic 82.1% |
| Immigrants | Mexico | 0.0 /100 | #309 | Tragic 82.0% |
| Cajuns | 0.0 /100 | #310 | Tragic 82.0% |
| Chickasaw | 0.0 /100 | #311 | Tragic 81.9% |
| Mexicans | 0.0 /100 | #312 | Tragic 81.9% |
Demographics Similar to Germans by In Labor Force | Age 30-34
In terms of in labor force | age 30-34, the demographic groups most similar to Germans are Immigrants from Ukraine (84.8%, a difference of 0.0%), Immigrants from Saudi Arabia (84.9%, a difference of 0.010%), Immigrants from Colombia (84.9%, a difference of 0.010%), Immigrants from Pakistan (84.9%, a difference of 0.010%), and Immigrants from Senegal (84.8%, a difference of 0.010%).
| Demographics | Rating | Rank | In Labor Force | Age 30-34 |
| Colombians | 82.2 /100 | #143 | Excellent 84.9% |
| Uruguayans | 78.5 /100 | #144 | Good 84.9% |
| Palestinians | 77.7 /100 | #145 | Good 84.9% |
| Immigrants | Saudi Arabia | 76.6 /100 | #146 | Good 84.9% |
| Immigrants | Colombia | 76.3 /100 | #147 | Good 84.9% |
| Immigrants | Pakistan | 76.2 /100 | #148 | Good 84.9% |
| Immigrants | Ukraine | 75.1 /100 | #149 | Good 84.8% |
| Germans | 75.1 /100 | #150 | Good 84.8% |
| Immigrants | Senegal | 74.0 /100 | #151 | Good 84.8% |
| Romanians | 73.5 /100 | #152 | Good 84.8% |
| Syrians | 70.1 /100 | #153 | Good 84.8% |
| Northern Europeans | 70.0 /100 | #154 | Good 84.8% |
| Immigrants | Sudan | 69.5 /100 | #155 | Good 84.8% |
| French Canadians | 67.3 /100 | #156 | Good 84.8% |
| Peruvians | 65.9 /100 | #157 | Good 84.8% |