Osage vs Salvadoran In Labor Force | Age 30-34
COMPARE
Osage
Salvadoran
In Labor Force | Age 30-34
In Labor Force | Age 30-34 Comparison
Osage
Salvadorans
82.3%
IN LABOR FORCE | AGE 30-34
0.0/ 100
METRIC RATING
305th/ 347
METRIC RANK
84.2%
IN LABOR FORCE | AGE 30-34
3.8/ 100
METRIC RATING
221st/ 347
METRIC RANK
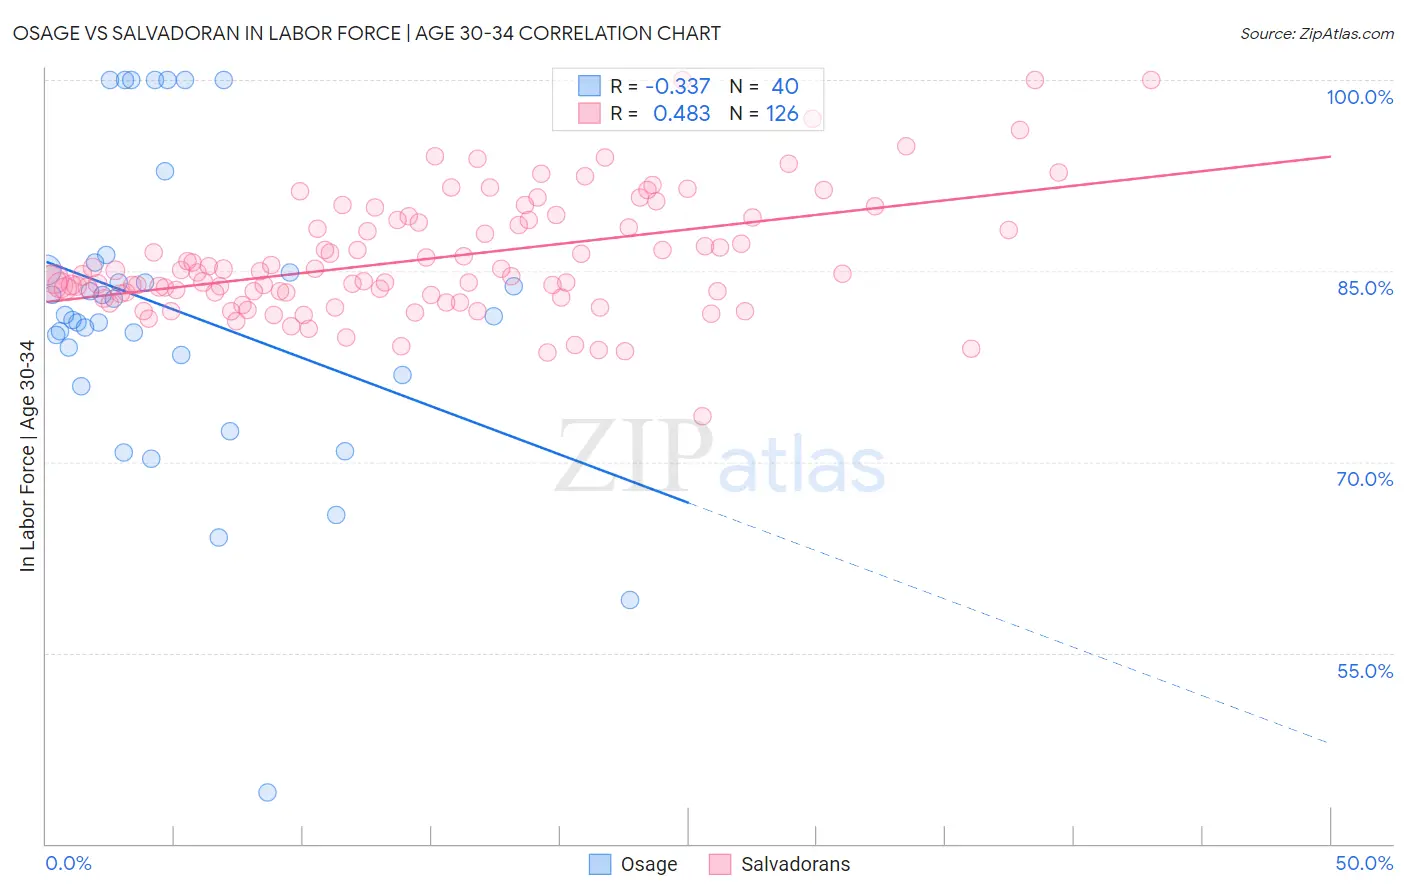
Osage vs Salvadoran In Labor Force | Age 30-34 Correlation Chart
The statistical analysis conducted on geographies consisting of 91,795,365 people shows a mild negative correlation between the proportion of Osage and labor force participation rate among population between the ages 30 and 34 in the United States with a correlation coefficient (R) of -0.337 and weighted average of 82.3%. Similarly, the statistical analysis conducted on geographies consisting of 398,763,176 people shows a moderate positive correlation between the proportion of Salvadorans and labor force participation rate among population between the ages 30 and 34 in the United States with a correlation coefficient (R) of 0.483 and weighted average of 84.2%, a difference of 2.4%.
In Labor Force | Age 30-34 Correlation Summary
| Measurement | Osage | Salvadoran |
| Minimum | 44.0% | 73.6% |
| Maximum | 100.0% | 100.0% |
| Range | 56.0% | 26.4% |
| Mean | 81.8% | 86.0% |
| Median | 81.5% | 84.7% |
| Interquartile 25% (IQ1) | 77.6% | 83.2% |
| Interquartile 75% (IQ3) | 85.4% | 89.0% |
| Interquartile Range (IQR) | 7.8% | 5.8% |
| Standard Deviation (Sample) | 12.0% | 4.7% |
| Standard Deviation (Population) | 11.8% | 4.7% |
Similar Demographics by In Labor Force | Age 30-34
Demographics Similar to Osage by In Labor Force | Age 30-34
In terms of in labor force | age 30-34, the demographic groups most similar to Osage are Spanish American Indian (82.2%, a difference of 0.020%), Menominee (82.2%, a difference of 0.070%), Tlingit-Haida (82.3%, a difference of 0.080%), Immigrants from Micronesia (82.4%, a difference of 0.16%), and Ottawa (82.4%, a difference of 0.17%).
| Demographics | Rating | Rank | In Labor Force | Age 30-34 |
| Aleuts | 0.0 /100 | #298 | Tragic 82.6% |
| Immigrants | Central America | 0.0 /100 | #299 | Tragic 82.5% |
| Hmong | 0.0 /100 | #300 | Tragic 82.4% |
| Hispanics or Latinos | 0.0 /100 | #301 | Tragic 82.4% |
| Ottawa | 0.0 /100 | #302 | Tragic 82.4% |
| Immigrants | Micronesia | 0.0 /100 | #303 | Tragic 82.4% |
| Tlingit-Haida | 0.0 /100 | #304 | Tragic 82.3% |
| Osage | 0.0 /100 | #305 | Tragic 82.3% |
| Spanish American Indians | 0.0 /100 | #306 | Tragic 82.2% |
| Menominee | 0.0 /100 | #307 | Tragic 82.2% |
| Puget Sound Salish | 0.0 /100 | #308 | Tragic 82.1% |
| Immigrants | Mexico | 0.0 /100 | #309 | Tragic 82.0% |
| Cajuns | 0.0 /100 | #310 | Tragic 82.0% |
| Chickasaw | 0.0 /100 | #311 | Tragic 81.9% |
| Mexicans | 0.0 /100 | #312 | Tragic 81.9% |
Demographics Similar to Salvadorans by In Labor Force | Age 30-34
In terms of in labor force | age 30-34, the demographic groups most similar to Salvadorans are Panamanian (84.2%, a difference of 0.0%), Immigrants from Laos (84.2%, a difference of 0.010%), Cuban (84.2%, a difference of 0.020%), Scottish (84.2%, a difference of 0.040%), and Immigrants from El Salvador (84.2%, a difference of 0.040%).
| Demographics | Rating | Rank | In Labor Force | Age 30-34 |
| Immigrants | Germany | 7.2 /100 | #214 | Tragic 84.3% |
| Europeans | 7.2 /100 | #215 | Tragic 84.3% |
| Immigrants | Ecuador | 7.1 /100 | #216 | Tragic 84.3% |
| Immigrants | Trinidad and Tobago | 7.0 /100 | #217 | Tragic 84.3% |
| Immigrants | Panama | 6.3 /100 | #218 | Tragic 84.3% |
| Swiss | 5.8 /100 | #219 | Tragic 84.3% |
| Danes | 5.3 /100 | #220 | Tragic 84.3% |
| Salvadorans | 3.8 /100 | #221 | Tragic 84.2% |
| Panamanians | 3.8 /100 | #222 | Tragic 84.2% |
| Immigrants | Laos | 3.6 /100 | #223 | Tragic 84.2% |
| Cubans | 3.4 /100 | #224 | Tragic 84.2% |
| Scottish | 3.1 /100 | #225 | Tragic 84.2% |
| Immigrants | El Salvador | 3.0 /100 | #226 | Tragic 84.2% |
| Immigrants | Cuba | 3.0 /100 | #227 | Tragic 84.2% |
| Immigrants | Haiti | 2.8 /100 | #228 | Tragic 84.2% |