Spaniard vs Ethiopian In Labor Force | Age 25-29
COMPARE
Spaniard
Ethiopian
In Labor Force | Age 25-29
In Labor Force | Age 25-29 Comparison
Spaniards
Ethiopians
83.7%
IN LABOR FORCE | AGE 25-29
0.2/ 100
METRIC RATING
254th/ 347
METRIC RANK
86.2%
IN LABOR FORCE | AGE 25-29
100.0/ 100
METRIC RATING
9th/ 347
METRIC RANK
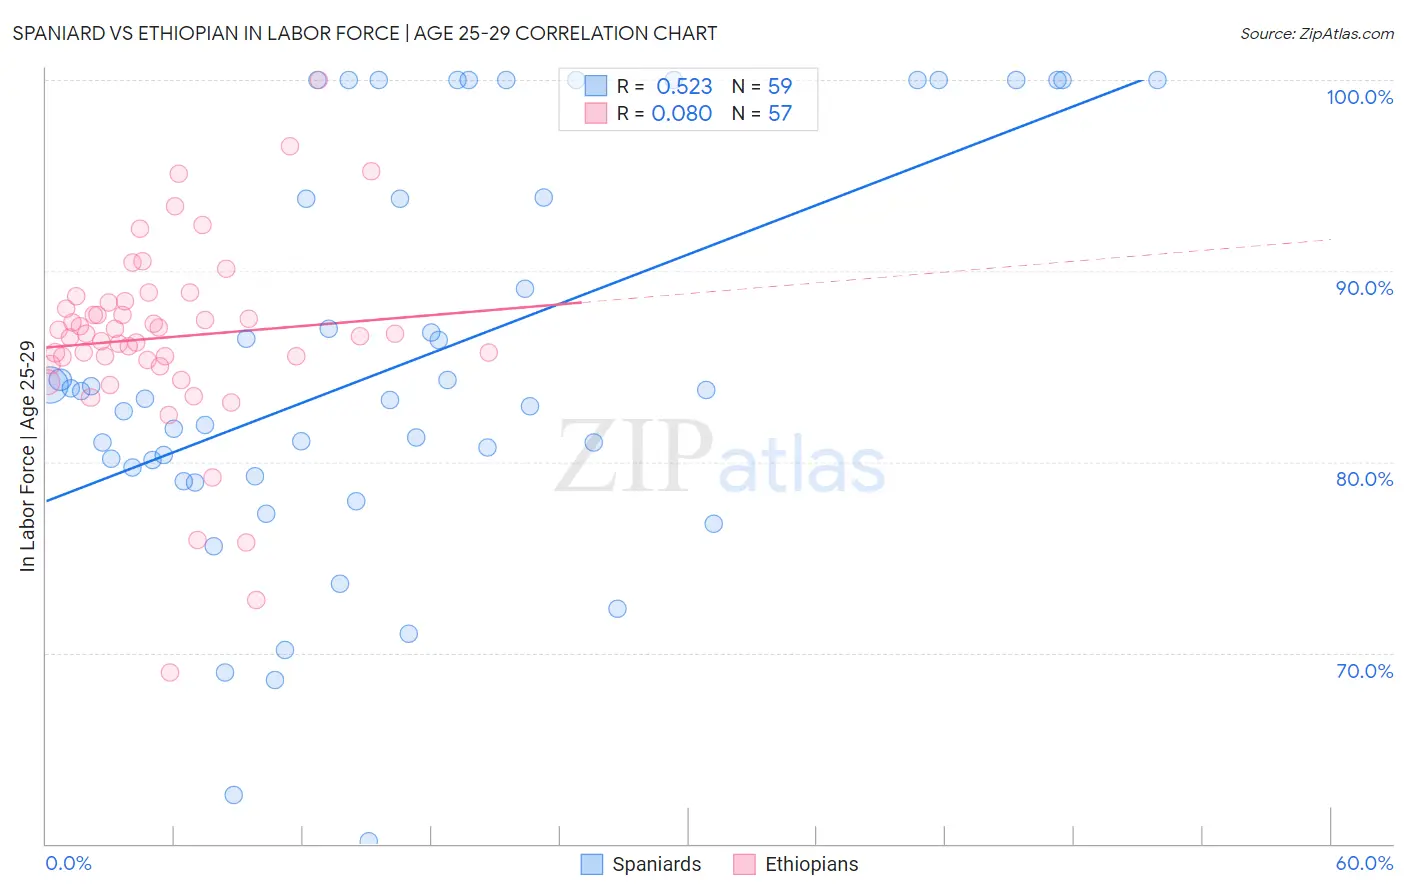
Spaniard vs Ethiopian In Labor Force | Age 25-29 Correlation Chart
The statistical analysis conducted on geographies consisting of 443,266,426 people shows a substantial positive correlation between the proportion of Spaniards and labor force participation rate among population between the ages 25 and 29 in the United States with a correlation coefficient (R) of 0.523 and weighted average of 83.7%. Similarly, the statistical analysis conducted on geographies consisting of 223,220,126 people shows a slight positive correlation between the proportion of Ethiopians and labor force participation rate among population between the ages 25 and 29 in the United States with a correlation coefficient (R) of 0.080 and weighted average of 86.2%, a difference of 3.0%.
In Labor Force | Age 25-29 Correlation Summary
| Measurement | Spaniard | Ethiopian |
| Minimum | 60.2% | 69.0% |
| Maximum | 100.0% | 100.0% |
| Range | 39.8% | 31.0% |
| Mean | 85.1% | 86.5% |
| Median | 83.3% | 86.7% |
| Interquartile 25% (IQ1) | 79.2% | 85.2% |
| Interquartile 75% (IQ3) | 93.8% | 88.4% |
| Interquartile Range (IQR) | 14.6% | 3.2% |
| Standard Deviation (Sample) | 10.5% | 5.1% |
| Standard Deviation (Population) | 10.4% | 5.1% |
Similar Demographics by In Labor Force | Age 25-29
Demographics Similar to Spaniards by In Labor Force | Age 25-29
In terms of in labor force | age 25-29, the demographic groups most similar to Spaniards are Guatemalan (83.7%, a difference of 0.0%), Immigrants from Trinidad and Tobago (83.7%, a difference of 0.0%), Bahamian (83.7%, a difference of 0.010%), Haitian (83.7%, a difference of 0.010%), and Immigrants from Haiti (83.7%, a difference of 0.020%).
| Demographics | Rating | Rank | In Labor Force | Age 25-29 |
| Immigrants | El Salvador | 0.3 /100 | #247 | Tragic 83.7% |
| Immigrants | Nonimmigrants | 0.3 /100 | #248 | Tragic 83.7% |
| Hmong | 0.3 /100 | #249 | Tragic 83.7% |
| Central Americans | 0.2 /100 | #250 | Tragic 83.7% |
| Bahamians | 0.2 /100 | #251 | Tragic 83.7% |
| Guatemalans | 0.2 /100 | #252 | Tragic 83.7% |
| Immigrants | Trinidad and Tobago | 0.2 /100 | #253 | Tragic 83.7% |
| Spaniards | 0.2 /100 | #254 | Tragic 83.7% |
| Haitians | 0.2 /100 | #255 | Tragic 83.7% |
| Immigrants | Haiti | 0.2 /100 | #256 | Tragic 83.7% |
| Delaware | 0.2 /100 | #257 | Tragic 83.7% |
| Immigrants | Guatemala | 0.1 /100 | #258 | Tragic 83.6% |
| Spanish | 0.1 /100 | #259 | Tragic 83.6% |
| Immigrants | Bahamas | 0.1 /100 | #260 | Tragic 83.6% |
| Pennsylvania Germans | 0.1 /100 | #261 | Tragic 83.6% |
Demographics Similar to Ethiopians by In Labor Force | Age 25-29
In terms of in labor force | age 25-29, the demographic groups most similar to Ethiopians are Immigrants from Cabo Verde (86.2%, a difference of 0.030%), Liberian (86.1%, a difference of 0.050%), Immigrants from Ethiopia (86.1%, a difference of 0.050%), Immigrants from Lithuania (86.1%, a difference of 0.060%), and Norwegian (86.1%, a difference of 0.070%).
| Demographics | Rating | Rank | In Labor Force | Age 25-29 |
| Immigrants | Somalia | 100.0 /100 | #2 | Exceptional 87.1% |
| Somalis | 100.0 /100 | #3 | Exceptional 87.1% |
| Carpatho Rusyns | 100.0 /100 | #4 | Exceptional 87.0% |
| Luxembourgers | 100.0 /100 | #5 | Exceptional 86.9% |
| Slovenes | 100.0 /100 | #6 | Exceptional 86.4% |
| Immigrants | Bosnia and Herzegovina | 100.0 /100 | #7 | Exceptional 86.3% |
| Immigrants | Cabo Verde | 100.0 /100 | #8 | Exceptional 86.2% |
| Ethiopians | 100.0 /100 | #9 | Exceptional 86.2% |
| Liberians | 100.0 /100 | #10 | Exceptional 86.1% |
| Immigrants | Ethiopia | 100.0 /100 | #11 | Exceptional 86.1% |
| Immigrants | Lithuania | 100.0 /100 | #12 | Exceptional 86.1% |
| Norwegians | 100.0 /100 | #13 | Exceptional 86.1% |
| Latvians | 100.0 /100 | #14 | Exceptional 86.1% |
| Bolivians | 100.0 /100 | #15 | Exceptional 86.1% |
| Immigrants | Bolivia | 100.0 /100 | #16 | Exceptional 86.1% |