Immigrants from Nicaragua vs Liberian In Labor Force | Age 45-54
COMPARE
Immigrants from Nicaragua
Liberian
In Labor Force | Age 45-54
In Labor Force | Age 45-54 Comparison
Immigrants from Nicaragua
Liberians
82.7%
IN LABOR FORCE | AGE 45-54
44.6/ 100
METRIC RATING
177th/ 347
METRIC RANK
83.0%
IN LABOR FORCE | AGE 45-54
82.7/ 100
METRIC RATING
133rd/ 347
METRIC RANK
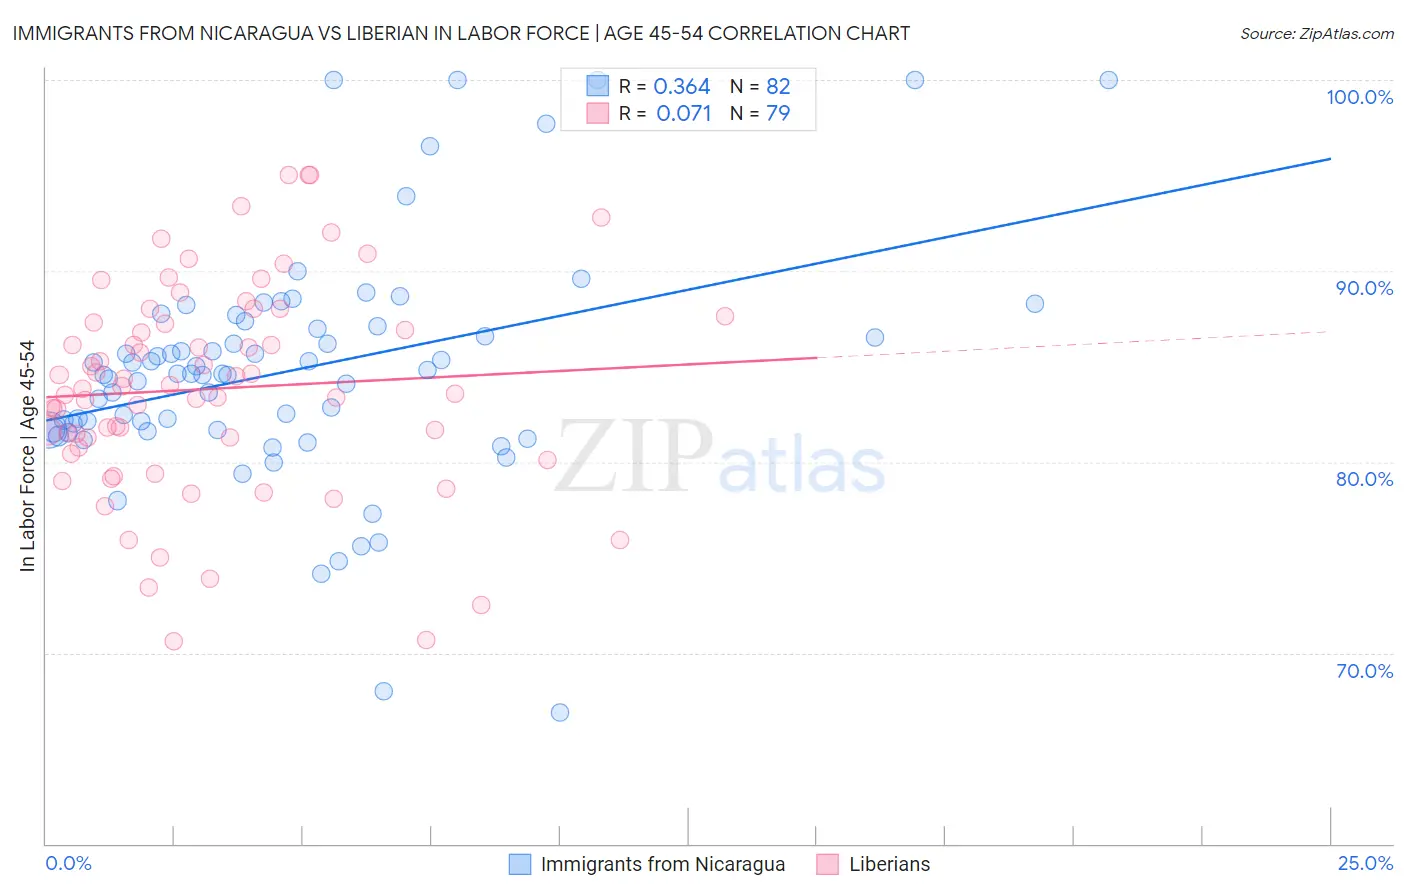
Immigrants from Nicaragua vs Liberian In Labor Force | Age 45-54 Correlation Chart
The statistical analysis conducted on geographies consisting of 236,320,192 people shows a mild positive correlation between the proportion of Immigrants from Nicaragua and labor force participation rate among population between the ages 45 and 54 in the United States with a correlation coefficient (R) of 0.364 and weighted average of 82.7%. Similarly, the statistical analysis conducted on geographies consisting of 118,034,202 people shows a slight positive correlation between the proportion of Liberians and labor force participation rate among population between the ages 45 and 54 in the United States with a correlation coefficient (R) of 0.071 and weighted average of 83.0%, a difference of 0.39%.
In Labor Force | Age 45-54 Correlation Summary
| Measurement | Immigrants from Nicaragua | Liberian |
| Minimum | 66.9% | 70.6% |
| Maximum | 100.0% | 95.0% |
| Range | 33.1% | 24.4% |
| Mean | 84.8% | 83.8% |
| Median | 84.6% | 83.8% |
| Interquartile 25% (IQ1) | 81.7% | 80.7% |
| Interquartile 75% (IQ3) | 87.1% | 87.3% |
| Interquartile Range (IQR) | 5.4% | 6.6% |
| Standard Deviation (Sample) | 6.2% | 5.5% |
| Standard Deviation (Population) | 6.1% | 5.4% |
Similar Demographics by In Labor Force | Age 45-54
Demographics Similar to Immigrants from Nicaragua by In Labor Force | Age 45-54
In terms of in labor force | age 45-54, the demographic groups most similar to Immigrants from Nicaragua are Northern European (82.7%, a difference of 0.020%), Immigrants from Liberia (82.7%, a difference of 0.030%), Nigerian (82.7%, a difference of 0.040%), Nicaraguan (82.8%, a difference of 0.050%), and Costa Rican (82.8%, a difference of 0.050%).
| Demographics | Rating | Rank | In Labor Force | Age 45-54 |
| Pakistanis | 53.2 /100 | #170 | Average 82.8% |
| Immigrants | Zaire | 52.9 /100 | #171 | Average 82.8% |
| Icelanders | 51.8 /100 | #172 | Average 82.8% |
| Nicaraguans | 50.3 /100 | #173 | Average 82.8% |
| Costa Ricans | 50.0 /100 | #174 | Average 82.8% |
| Immigrants | Liberia | 47.9 /100 | #175 | Average 82.7% |
| Northern Europeans | 46.9 /100 | #176 | Average 82.7% |
| Immigrants | Nicaragua | 44.6 /100 | #177 | Average 82.7% |
| Nigerians | 40.5 /100 | #178 | Average 82.7% |
| Immigrants | Switzerland | 39.4 /100 | #179 | Fair 82.7% |
| Hungarians | 38.0 /100 | #180 | Fair 82.7% |
| Israelis | 37.7 /100 | #181 | Fair 82.7% |
| Immigrants | Hungary | 37.1 /100 | #182 | Fair 82.7% |
| New Zealanders | 32.7 /100 | #183 | Fair 82.6% |
| Europeans | 32.6 /100 | #184 | Fair 82.6% |
Demographics Similar to Liberians by In Labor Force | Age 45-54
In terms of in labor force | age 45-54, the demographic groups most similar to Liberians are Immigrants from Ukraine (83.0%, a difference of 0.0%), Finnish (83.1%, a difference of 0.010%), Sudanese (83.0%, a difference of 0.010%), Austrian (83.0%, a difference of 0.020%), and Immigrants from Israel (83.1%, a difference of 0.030%).
| Demographics | Rating | Rank | In Labor Force | Age 45-54 |
| Immigrants | Belgium | 86.4 /100 | #126 | Excellent 83.1% |
| Immigrants | Jordan | 85.2 /100 | #127 | Excellent 83.1% |
| Germans | 85.1 /100 | #128 | Excellent 83.1% |
| Immigrants | Northern Europe | 85.1 /100 | #129 | Excellent 83.1% |
| Immigrants | Israel | 84.7 /100 | #130 | Excellent 83.1% |
| Finns | 83.3 /100 | #131 | Excellent 83.1% |
| Immigrants | Ukraine | 82.9 /100 | #132 | Excellent 83.0% |
| Liberians | 82.7 /100 | #133 | Excellent 83.0% |
| Sudanese | 82.0 /100 | #134 | Excellent 83.0% |
| Austrians | 81.3 /100 | #135 | Excellent 83.0% |
| Immigrants | Kazakhstan | 81.0 /100 | #136 | Excellent 83.0% |
| Immigrants | Spain | 80.4 /100 | #137 | Excellent 83.0% |
| Ghanaians | 79.5 /100 | #138 | Good 83.0% |
| Scandinavians | 78.5 /100 | #139 | Good 83.0% |
| Yugoslavians | 78.3 /100 | #140 | Good 83.0% |