Immigrants from Guatemala vs Liberian In Labor Force | Age 45-54
COMPARE
Immigrants from Guatemala
Liberian
In Labor Force | Age 45-54
In Labor Force | Age 45-54 Comparison
Immigrants from Guatemala
Liberians
81.1%
IN LABOR FORCE | AGE 45-54
0.0/ 100
METRIC RATING
278th/ 347
METRIC RANK
83.0%
IN LABOR FORCE | AGE 45-54
82.7/ 100
METRIC RATING
133rd/ 347
METRIC RANK
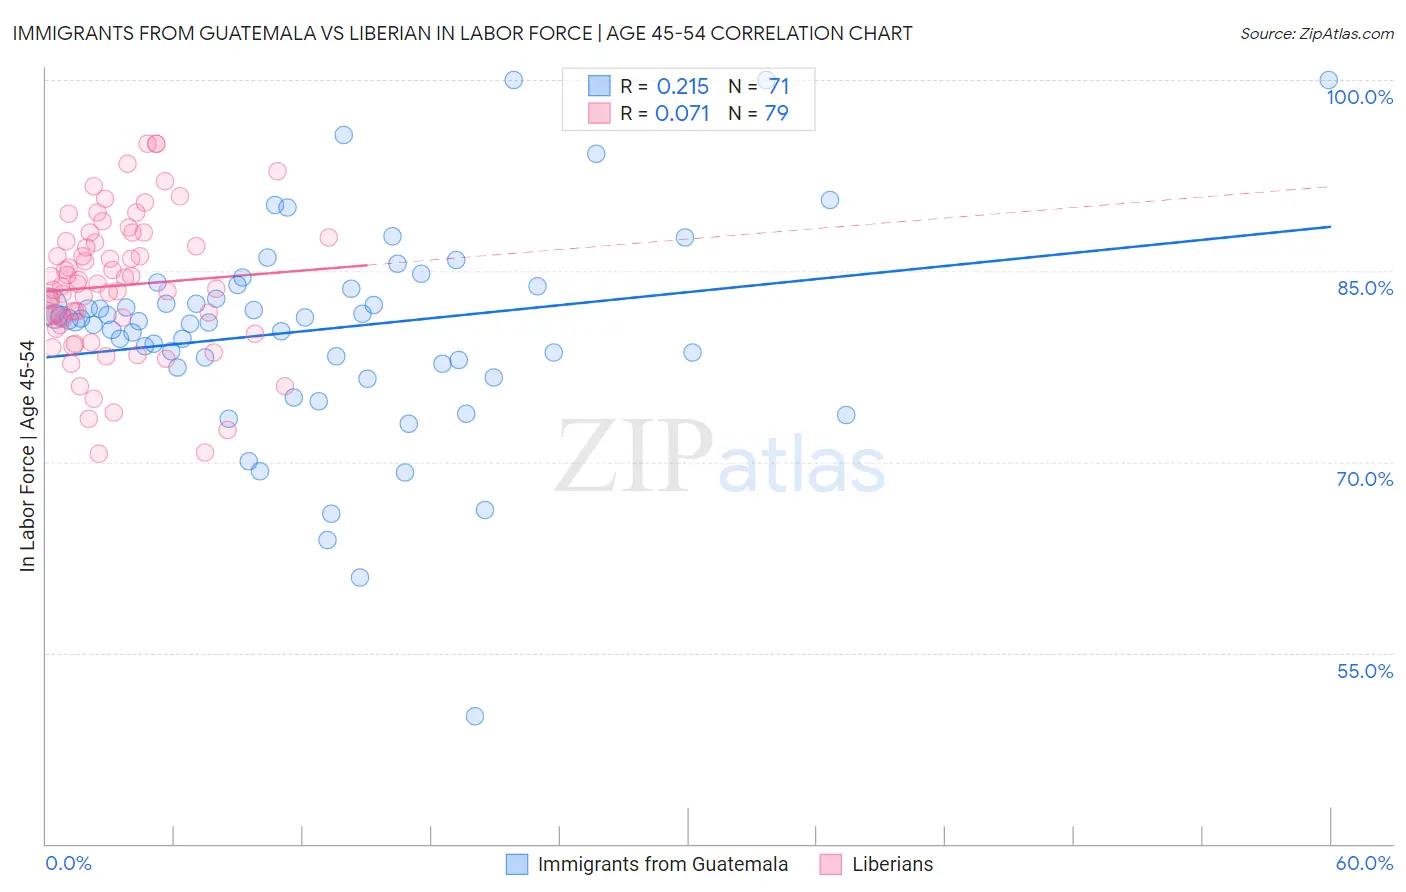
Immigrants from Guatemala vs Liberian In Labor Force | Age 45-54 Correlation Chart
The statistical analysis conducted on geographies consisting of 377,151,916 people shows a weak positive correlation between the proportion of Immigrants from Guatemala and labor force participation rate among population between the ages 45 and 54 in the United States with a correlation coefficient (R) of 0.215 and weighted average of 81.1%. Similarly, the statistical analysis conducted on geographies consisting of 118,034,202 people shows a slight positive correlation between the proportion of Liberians and labor force participation rate among population between the ages 45 and 54 in the United States with a correlation coefficient (R) of 0.071 and weighted average of 83.0%, a difference of 2.4%.
In Labor Force | Age 45-54 Correlation Summary
| Measurement | Immigrants from Guatemala | Liberian |
| Minimum | 50.0% | 70.6% |
| Maximum | 100.0% | 95.0% |
| Range | 50.0% | 24.4% |
| Mean | 80.4% | 83.8% |
| Median | 81.1% | 83.8% |
| Interquartile 25% (IQ1) | 77.7% | 80.7% |
| Interquartile 75% (IQ3) | 83.8% | 87.3% |
| Interquartile Range (IQR) | 6.1% | 6.6% |
| Standard Deviation (Sample) | 8.3% | 5.5% |
| Standard Deviation (Population) | 8.3% | 5.4% |
Similar Demographics by In Labor Force | Age 45-54
Demographics Similar to Immigrants from Guatemala by In Labor Force | Age 45-54
In terms of in labor force | age 45-54, the demographic groups most similar to Immigrants from Guatemala are Immigrants from Micronesia (81.1%, a difference of 0.010%), Guatemalan (81.2%, a difference of 0.080%), U.S. Virgin Islander (81.2%, a difference of 0.10%), Immigrants from Latin America (81.0%, a difference of 0.11%), and Immigrants from Grenada (81.0%, a difference of 0.12%).
| Demographics | Rating | Rank | In Labor Force | Age 45-54 |
| Immigrants | Barbados | 0.0 /100 | #271 | Tragic 81.3% |
| Spanish | 0.0 /100 | #272 | Tragic 81.3% |
| Chippewa | 0.0 /100 | #273 | Tragic 81.3% |
| British West Indians | 0.0 /100 | #274 | Tragic 81.2% |
| Immigrants | Nonimmigrants | 0.0 /100 | #275 | Tragic 81.2% |
| U.S. Virgin Islanders | 0.0 /100 | #276 | Tragic 81.2% |
| Guatemalans | 0.0 /100 | #277 | Tragic 81.2% |
| Immigrants | Guatemala | 0.0 /100 | #278 | Tragic 81.1% |
| Immigrants | Micronesia | 0.0 /100 | #279 | Tragic 81.1% |
| Immigrants | Latin America | 0.0 /100 | #280 | Tragic 81.0% |
| Immigrants | Grenada | 0.0 /100 | #281 | Tragic 81.0% |
| Aleuts | 0.0 /100 | #282 | Tragic 81.0% |
| French American Indians | 0.0 /100 | #283 | Tragic 80.8% |
| Belizeans | 0.0 /100 | #284 | Tragic 80.8% |
| Delaware | 0.0 /100 | #285 | Tragic 80.8% |
Demographics Similar to Liberians by In Labor Force | Age 45-54
In terms of in labor force | age 45-54, the demographic groups most similar to Liberians are Immigrants from Ukraine (83.0%, a difference of 0.0%), Finnish (83.1%, a difference of 0.010%), Sudanese (83.0%, a difference of 0.010%), Austrian (83.0%, a difference of 0.020%), and Immigrants from Israel (83.1%, a difference of 0.030%).
| Demographics | Rating | Rank | In Labor Force | Age 45-54 |
| Immigrants | Belgium | 86.4 /100 | #126 | Excellent 83.1% |
| Immigrants | Jordan | 85.2 /100 | #127 | Excellent 83.1% |
| Germans | 85.1 /100 | #128 | Excellent 83.1% |
| Immigrants | Northern Europe | 85.1 /100 | #129 | Excellent 83.1% |
| Immigrants | Israel | 84.7 /100 | #130 | Excellent 83.1% |
| Finns | 83.3 /100 | #131 | Excellent 83.1% |
| Immigrants | Ukraine | 82.9 /100 | #132 | Excellent 83.0% |
| Liberians | 82.7 /100 | #133 | Excellent 83.0% |
| Sudanese | 82.0 /100 | #134 | Excellent 83.0% |
| Austrians | 81.3 /100 | #135 | Excellent 83.0% |
| Immigrants | Kazakhstan | 81.0 /100 | #136 | Excellent 83.0% |
| Immigrants | Spain | 80.4 /100 | #137 | Excellent 83.0% |
| Ghanaians | 79.5 /100 | #138 | Good 83.0% |
| Scandinavians | 78.5 /100 | #139 | Good 83.0% |
| Yugoslavians | 78.3 /100 | #140 | Good 83.0% |