Nonimmigrants vs Aleut Householder Income Under 25 years
COMPARE
Nonimmigrants
Aleut
Householder Income Under 25 years
Householder Income Under 25 years Comparison
Nonimmigrants
Aleuts
$49,348
HOUSEHOLDER INCOME UNDER 25 YEARS
0.1/ 100
METRIC RATING
281st/ 347
METRIC RANK
$50,377
HOUSEHOLDER INCOME UNDER 25 YEARS
1.2/ 100
METRIC RATING
255th/ 347
METRIC RANK
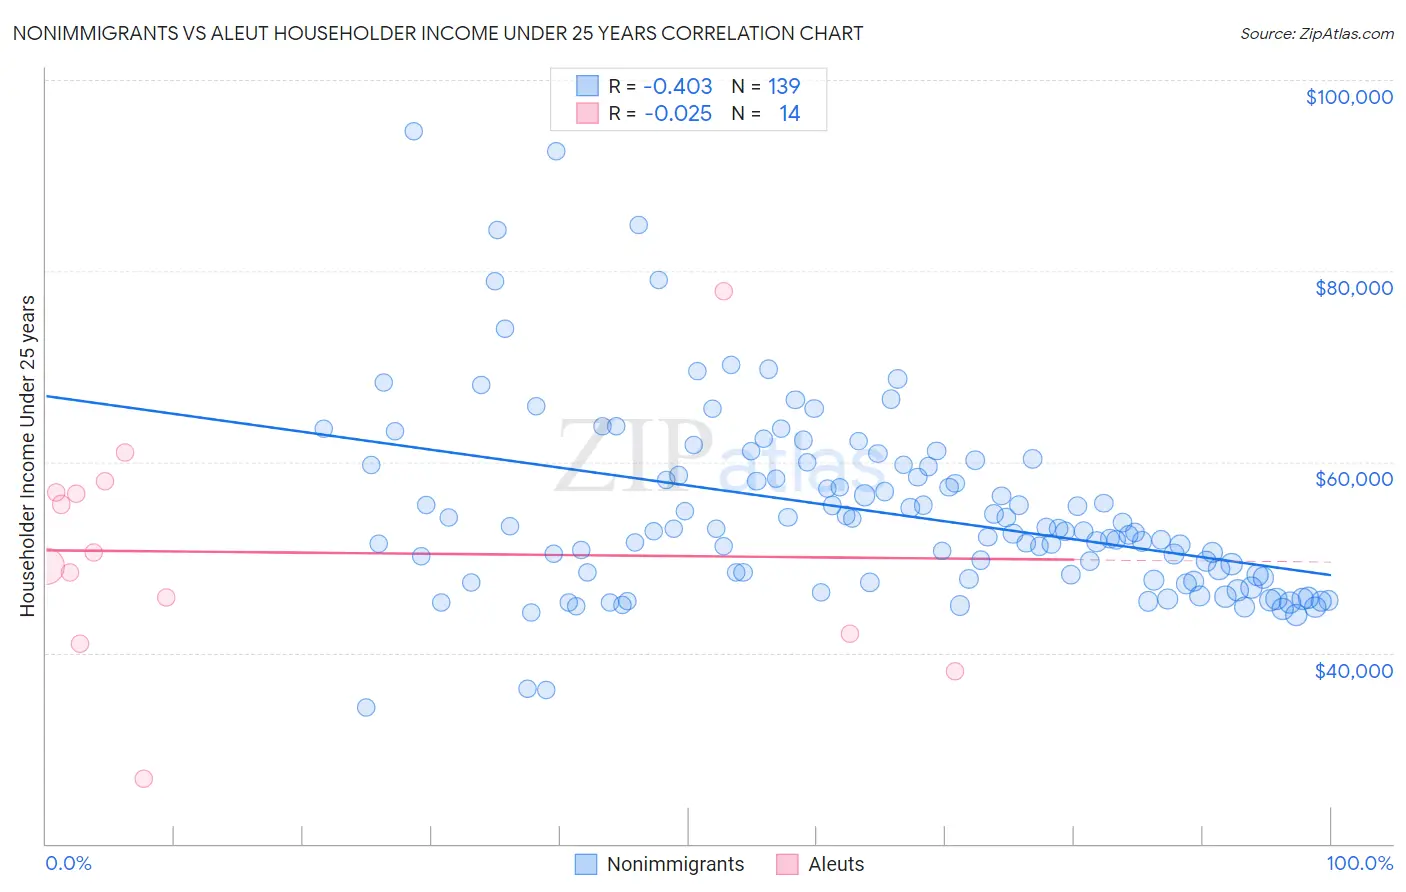
Nonimmigrants vs Aleut Householder Income Under 25 years Correlation Chart
The statistical analysis conducted on geographies consisting of 441,912,887 people shows a moderate negative correlation between the proportion of Nonimmigrants and household income with householder under the age of 25 in the United States with a correlation coefficient (R) of -0.403 and weighted average of $49,348. Similarly, the statistical analysis conducted on geographies consisting of 59,196,201 people shows no correlation between the proportion of Aleuts and household income with householder under the age of 25 in the United States with a correlation coefficient (R) of -0.025 and weighted average of $50,377, a difference of 2.1%.
Householder Income Under 25 years Correlation Summary
| Measurement | Nonimmigrants | Aleut |
| Minimum | $34,271 | $26,849 |
| Maximum | $94,688 | $77,813 |
| Range | $60,417 | $50,964 |
| Mean | $54,795 | $50,533 |
| Median | $52,736 | $49,760 |
| Interquartile 25% (IQ1) | $47,750 | $42,031 |
| Interquartile 75% (IQ3) | $59,631 | $56,735 |
| Interquartile Range (IQR) | $11,881 | $14,704 |
| Standard Deviation (Sample) | $9,929 | $12,149 |
| Standard Deviation (Population) | $9,893 | $11,707 |
Similar Demographics by Householder Income Under 25 years
Demographics Similar to Nonimmigrants by Householder Income Under 25 years
In terms of householder income under 25 years, the demographic groups most similar to Nonimmigrants are Hmong ($49,364, a difference of 0.030%), Apache ($49,395, a difference of 0.090%), Nigerian ($49,416, a difference of 0.14%), Alsatian ($49,267, a difference of 0.16%), and Immigrants from Nigeria ($49,174, a difference of 0.35%).
| Demographics | Rating | Rank | Householder Income Under 25 years |
| Immigrants | Senegal | 0.3 /100 | #274 | Tragic $49,742 |
| Immigrants | Kenya | 0.2 /100 | #275 | Tragic $49,633 |
| Dominicans | 0.2 /100 | #276 | Tragic $49,633 |
| Immigrants | Western Africa | 0.2 /100 | #277 | Tragic $49,621 |
| Nigerians | 0.1 /100 | #278 | Tragic $49,416 |
| Apache | 0.1 /100 | #279 | Tragic $49,395 |
| Hmong | 0.1 /100 | #280 | Tragic $49,364 |
| Immigrants | Nonimmigrants | 0.1 /100 | #281 | Tragic $49,348 |
| Alsatians | 0.1 /100 | #282 | Tragic $49,267 |
| Immigrants | Nigeria | 0.1 /100 | #283 | Tragic $49,174 |
| Carpatho Rusyns | 0.1 /100 | #284 | Tragic $49,113 |
| Scotch-Irish | 0.0 /100 | #285 | Tragic $49,039 |
| French American Indians | 0.0 /100 | #286 | Tragic $48,977 |
| Senegalese | 0.0 /100 | #287 | Tragic $48,953 |
| Liberians | 0.0 /100 | #288 | Tragic $48,917 |
Demographics Similar to Aleuts by Householder Income Under 25 years
In terms of householder income under 25 years, the demographic groups most similar to Aleuts are Immigrants from Cuba ($50,374, a difference of 0.0%), Luxembourger ($50,379, a difference of 0.010%), Immigrants from Haiti ($50,398, a difference of 0.040%), Lebanese ($50,355, a difference of 0.040%), and White/Caucasian ($50,336, a difference of 0.080%).
| Demographics | Rating | Rank | Householder Income Under 25 years |
| Slavs | 1.8 /100 | #248 | Tragic $50,563 |
| Scottish | 1.8 /100 | #249 | Tragic $50,554 |
| Immigrants | Cabo Verde | 1.7 /100 | #250 | Tragic $50,520 |
| Celtics | 1.4 /100 | #251 | Tragic $50,447 |
| Immigrants | Mexico | 1.3 /100 | #252 | Tragic $50,422 |
| Immigrants | Haiti | 1.2 /100 | #253 | Tragic $50,398 |
| Luxembourgers | 1.2 /100 | #254 | Tragic $50,379 |
| Aleuts | 1.2 /100 | #255 | Tragic $50,377 |
| Immigrants | Cuba | 1.2 /100 | #256 | Tragic $50,374 |
| Lebanese | 1.1 /100 | #257 | Tragic $50,355 |
| Whites/Caucasians | 1.1 /100 | #258 | Tragic $50,336 |
| Immigrants | Dominica | 1.0 /100 | #259 | Tragic $50,301 |
| Hispanics or Latinos | 0.9 /100 | #260 | Tragic $50,279 |
| Hungarians | 0.9 /100 | #261 | Tragic $50,247 |
| Haitians | 0.8 /100 | #262 | Tragic $50,231 |