Nigerian vs Spanish In Labor Force | Age 25-29
COMPARE
Nigerian
Spanish
In Labor Force | Age 25-29
In Labor Force | Age 25-29 Comparison
Nigerians
Spanish
84.3%
IN LABOR FORCE | AGE 25-29
7.2/ 100
METRIC RATING
220th/ 347
METRIC RANK
83.6%
IN LABOR FORCE | AGE 25-29
0.1/ 100
METRIC RATING
259th/ 347
METRIC RANK
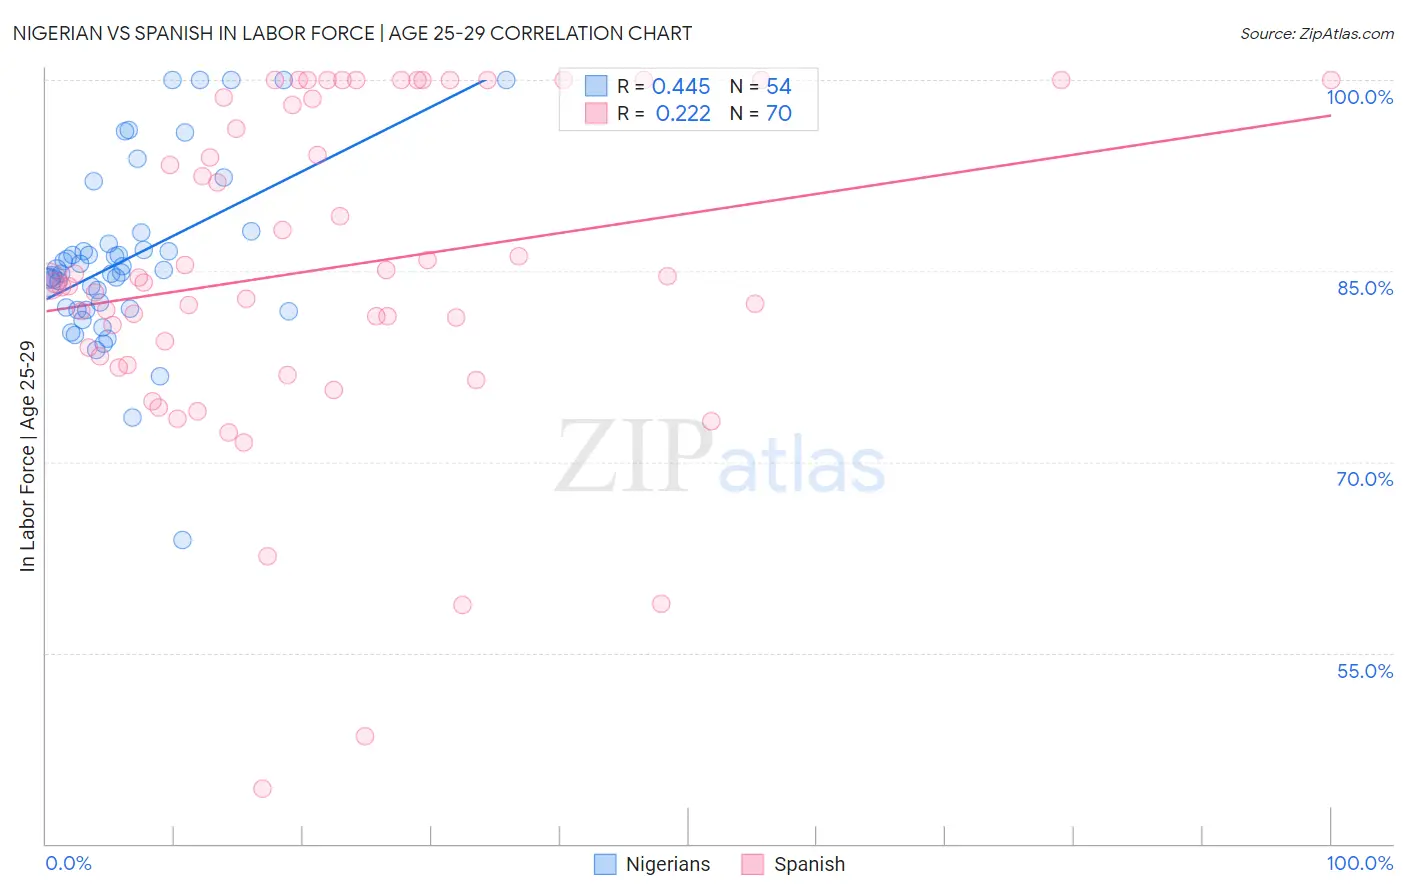
Nigerian vs Spanish In Labor Force | Age 25-29 Correlation Chart
The statistical analysis conducted on geographies consisting of 332,698,985 people shows a moderate positive correlation between the proportion of Nigerians and labor force participation rate among population between the ages 25 and 29 in the United States with a correlation coefficient (R) of 0.445 and weighted average of 84.3%. Similarly, the statistical analysis conducted on geographies consisting of 421,954,329 people shows a weak positive correlation between the proportion of Spanish and labor force participation rate among population between the ages 25 and 29 in the United States with a correlation coefficient (R) of 0.222 and weighted average of 83.6%, a difference of 0.76%.
In Labor Force | Age 25-29 Correlation Summary
| Measurement | Nigerian | Spanish |
| Minimum | 63.9% | 44.3% |
| Maximum | 100.0% | 100.0% |
| Range | 36.1% | 55.7% |
| Mean | 85.9% | 85.1% |
| Median | 85.0% | 84.1% |
| Interquartile 25% (IQ1) | 82.0% | 78.3% |
| Interquartile 75% (IQ3) | 87.1% | 98.6% |
| Interquartile Range (IQR) | 5.1% | 20.3% |
| Standard Deviation (Sample) | 6.9% | 12.6% |
| Standard Deviation (Population) | 6.9% | 12.5% |
Similar Demographics by In Labor Force | Age 25-29
Demographics Similar to Nigerians by In Labor Force | Age 25-29
In terms of in labor force | age 25-29, the demographic groups most similar to Nigerians are Arab (84.2%, a difference of 0.010%), Jordanian (84.2%, a difference of 0.010%), Scotch-Irish (84.2%, a difference of 0.020%), Immigrants from Nigeria (84.3%, a difference of 0.040%), and Immigrants from Saudi Arabia (84.3%, a difference of 0.040%).
| Demographics | Rating | Rank | In Labor Force | Age 25-29 |
| Japanese | 11.4 /100 | #213 | Poor 84.3% |
| Lebanese | 11.1 /100 | #214 | Poor 84.3% |
| Immigrants | Syria | 10.7 /100 | #215 | Poor 84.3% |
| Israelis | 9.3 /100 | #216 | Tragic 84.3% |
| Immigrants | Ecuador | 9.3 /100 | #217 | Tragic 84.3% |
| Immigrants | Nigeria | 9.0 /100 | #218 | Tragic 84.3% |
| Immigrants | Saudi Arabia | 8.8 /100 | #219 | Tragic 84.3% |
| Nigerians | 7.2 /100 | #220 | Tragic 84.3% |
| Arabs | 6.8 /100 | #221 | Tragic 84.2% |
| Jordanians | 6.7 /100 | #222 | Tragic 84.2% |
| Scotch-Irish | 6.5 /100 | #223 | Tragic 84.2% |
| Immigrants | West Indies | 6.0 /100 | #224 | Tragic 84.2% |
| Koreans | 5.9 /100 | #225 | Tragic 84.2% |
| Immigrants | Congo | 5.8 /100 | #226 | Tragic 84.2% |
| French American Indians | 5.5 /100 | #227 | Tragic 84.2% |
Demographics Similar to Spanish by In Labor Force | Age 25-29
In terms of in labor force | age 25-29, the demographic groups most similar to Spanish are Immigrants from Guatemala (83.6%, a difference of 0.010%), Immigrants from Bahamas (83.6%, a difference of 0.010%), Pennsylvania German (83.6%, a difference of 0.010%), Immigrants from Haiti (83.7%, a difference of 0.050%), and Delaware (83.7%, a difference of 0.050%).
| Demographics | Rating | Rank | In Labor Force | Age 25-29 |
| Guatemalans | 0.2 /100 | #252 | Tragic 83.7% |
| Immigrants | Trinidad and Tobago | 0.2 /100 | #253 | Tragic 83.7% |
| Spaniards | 0.2 /100 | #254 | Tragic 83.7% |
| Haitians | 0.2 /100 | #255 | Tragic 83.7% |
| Immigrants | Haiti | 0.2 /100 | #256 | Tragic 83.7% |
| Delaware | 0.2 /100 | #257 | Tragic 83.7% |
| Immigrants | Guatemala | 0.1 /100 | #258 | Tragic 83.6% |
| Spanish | 0.1 /100 | #259 | Tragic 83.6% |
| Immigrants | Bahamas | 0.1 /100 | #260 | Tragic 83.6% |
| Pennsylvania Germans | 0.1 /100 | #261 | Tragic 83.6% |
| Immigrants | Fiji | 0.1 /100 | #262 | Tragic 83.6% |
| West Indians | 0.1 /100 | #263 | Tragic 83.5% |
| Puget Sound Salish | 0.1 /100 | #264 | Tragic 83.5% |
| Cubans | 0.1 /100 | #265 | Tragic 83.5% |
| Aleuts | 0.0 /100 | #266 | Tragic 83.4% |