Immigrants from Bahamas vs Ugandan In Labor Force | Age 30-34
COMPARE
Immigrants from Bahamas
Ugandan
In Labor Force | Age 30-34
In Labor Force | Age 30-34 Comparison
Immigrants from Bahamas
Ugandans
84.1%
IN LABOR FORCE | AGE 30-34
2.6/ 100
METRIC RATING
230th/ 347
METRIC RANK
85.8%
IN LABOR FORCE | AGE 30-34
99.9/ 100
METRIC RATING
34th/ 347
METRIC RANK
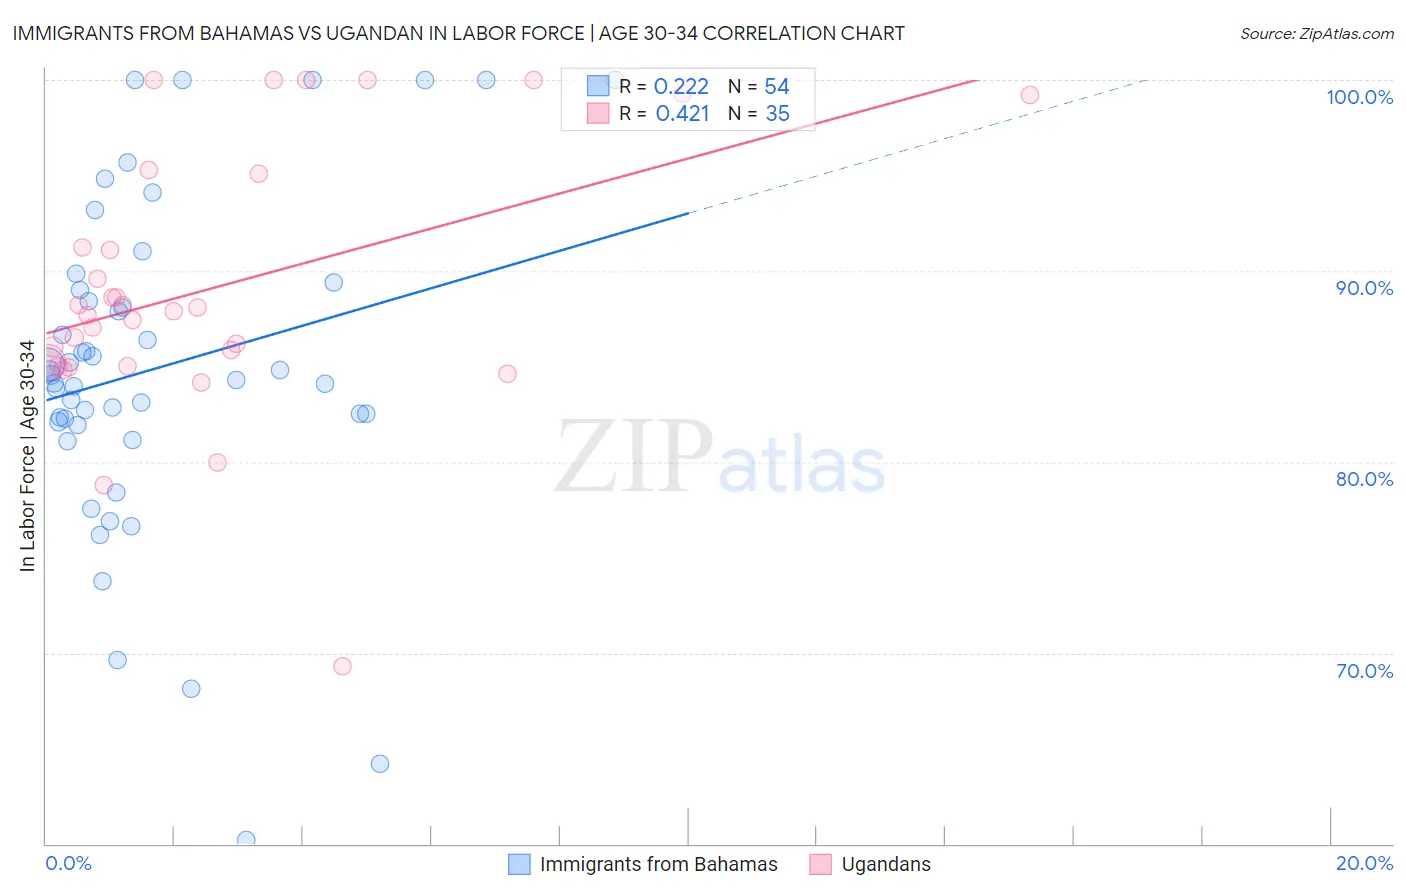
Immigrants from Bahamas vs Ugandan In Labor Force | Age 30-34 Correlation Chart
The statistical analysis conducted on geographies consisting of 104,609,089 people shows a weak positive correlation between the proportion of Immigrants from Bahamas and labor force participation rate among population between the ages 30 and 34 in the United States with a correlation coefficient (R) of 0.222 and weighted average of 84.1%. Similarly, the statistical analysis conducted on geographies consisting of 93,994,980 people shows a moderate positive correlation between the proportion of Ugandans and labor force participation rate among population between the ages 30 and 34 in the United States with a correlation coefficient (R) of 0.421 and weighted average of 85.8%, a difference of 1.9%.
In Labor Force | Age 30-34 Correlation Summary
| Measurement | Immigrants from Bahamas | Ugandan |
| Minimum | 60.2% | 69.3% |
| Maximum | 100.0% | 100.0% |
| Range | 39.8% | 30.7% |
| Mean | 84.9% | 89.1% |
| Median | 84.4% | 87.9% |
| Interquartile 25% (IQ1) | 82.1% | 85.0% |
| Interquartile 75% (IQ3) | 89.0% | 95.1% |
| Interquartile Range (IQR) | 6.9% | 10.1% |
| Standard Deviation (Sample) | 8.6% | 6.9% |
| Standard Deviation (Population) | 8.6% | 6.8% |
Similar Demographics by In Labor Force | Age 30-34
Demographics Similar to Immigrants from Bahamas by In Labor Force | Age 30-34
In terms of in labor force | age 30-34, the demographic groups most similar to Immigrants from Bahamas are Welsh (84.2%, a difference of 0.010%), Immigrants from Cuba (84.2%, a difference of 0.020%), Immigrants from Haiti (84.2%, a difference of 0.020%), Scottish (84.2%, a difference of 0.030%), and Immigrants from El Salvador (84.2%, a difference of 0.030%).
| Demographics | Rating | Rank | In Labor Force | Age 30-34 |
| Immigrants | Laos | 3.6 /100 | #223 | Tragic 84.2% |
| Cubans | 3.4 /100 | #224 | Tragic 84.2% |
| Scottish | 3.1 /100 | #225 | Tragic 84.2% |
| Immigrants | El Salvador | 3.0 /100 | #226 | Tragic 84.2% |
| Immigrants | Cuba | 3.0 /100 | #227 | Tragic 84.2% |
| Immigrants | Haiti | 2.8 /100 | #228 | Tragic 84.2% |
| Welsh | 2.7 /100 | #229 | Tragic 84.2% |
| Immigrants | Bahamas | 2.6 /100 | #230 | Tragic 84.1% |
| Malaysians | 2.2 /100 | #231 | Tragic 84.1% |
| Immigrants | Immigrants | 2.0 /100 | #232 | Tragic 84.1% |
| West Indians | 1.9 /100 | #233 | Tragic 84.1% |
| Haitians | 1.8 /100 | #234 | Tragic 84.1% |
| French American Indians | 1.7 /100 | #235 | Tragic 84.1% |
| U.S. Virgin Islanders | 1.5 /100 | #236 | Tragic 84.1% |
| Celtics | 1.4 /100 | #237 | Tragic 84.1% |
Demographics Similar to Ugandans by In Labor Force | Age 30-34
In terms of in labor force | age 30-34, the demographic groups most similar to Ugandans are Immigrants from Bosnia and Herzegovina (85.8%, a difference of 0.0%), Serbian (85.8%, a difference of 0.0%), Albanian (85.7%, a difference of 0.010%), Norwegian (85.7%, a difference of 0.020%), and Immigrants from Greece (85.7%, a difference of 0.020%).
| Demographics | Rating | Rank | In Labor Force | Age 30-34 |
| Immigrants | Liberia | 100.0 /100 | #27 | Exceptional 85.9% |
| Immigrants | Latvia | 100.0 /100 | #28 | Exceptional 85.9% |
| Tsimshian | 100.0 /100 | #29 | Exceptional 85.8% |
| Immigrants | Hong Kong | 100.0 /100 | #30 | Exceptional 85.8% |
| Paraguayans | 99.9 /100 | #31 | Exceptional 85.8% |
| Cypriots | 99.9 /100 | #32 | Exceptional 85.8% |
| Immigrants | Bosnia and Herzegovina | 99.9 /100 | #33 | Exceptional 85.8% |
| Ugandans | 99.9 /100 | #34 | Exceptional 85.8% |
| Serbians | 99.9 /100 | #35 | Exceptional 85.8% |
| Albanians | 99.9 /100 | #36 | Exceptional 85.7% |
| Norwegians | 99.9 /100 | #37 | Exceptional 85.7% |
| Immigrants | Greece | 99.9 /100 | #38 | Exceptional 85.7% |
| Eastern Europeans | 99.9 /100 | #39 | Exceptional 85.7% |
| Turks | 99.9 /100 | #40 | Exceptional 85.7% |
| Immigrants | Italy | 99.9 /100 | #41 | Exceptional 85.7% |