Immigrants from North Macedonia vs Immigrants from Uzbekistan In Labor Force | Age 30-34
COMPARE
Immigrants from North Macedonia
Immigrants from Uzbekistan
In Labor Force | Age 30-34
In Labor Force | Age 30-34 Comparison
Immigrants from North Macedonia
Immigrants from Uzbekistan
85.9%
IN LABOR FORCE | AGE 30-34
100.0/ 100
METRIC RATING
25th/ 347
METRIC RANK
84.7%
IN LABOR FORCE | AGE 30-34
49.1/ 100
METRIC RATING
176th/ 347
METRIC RANK
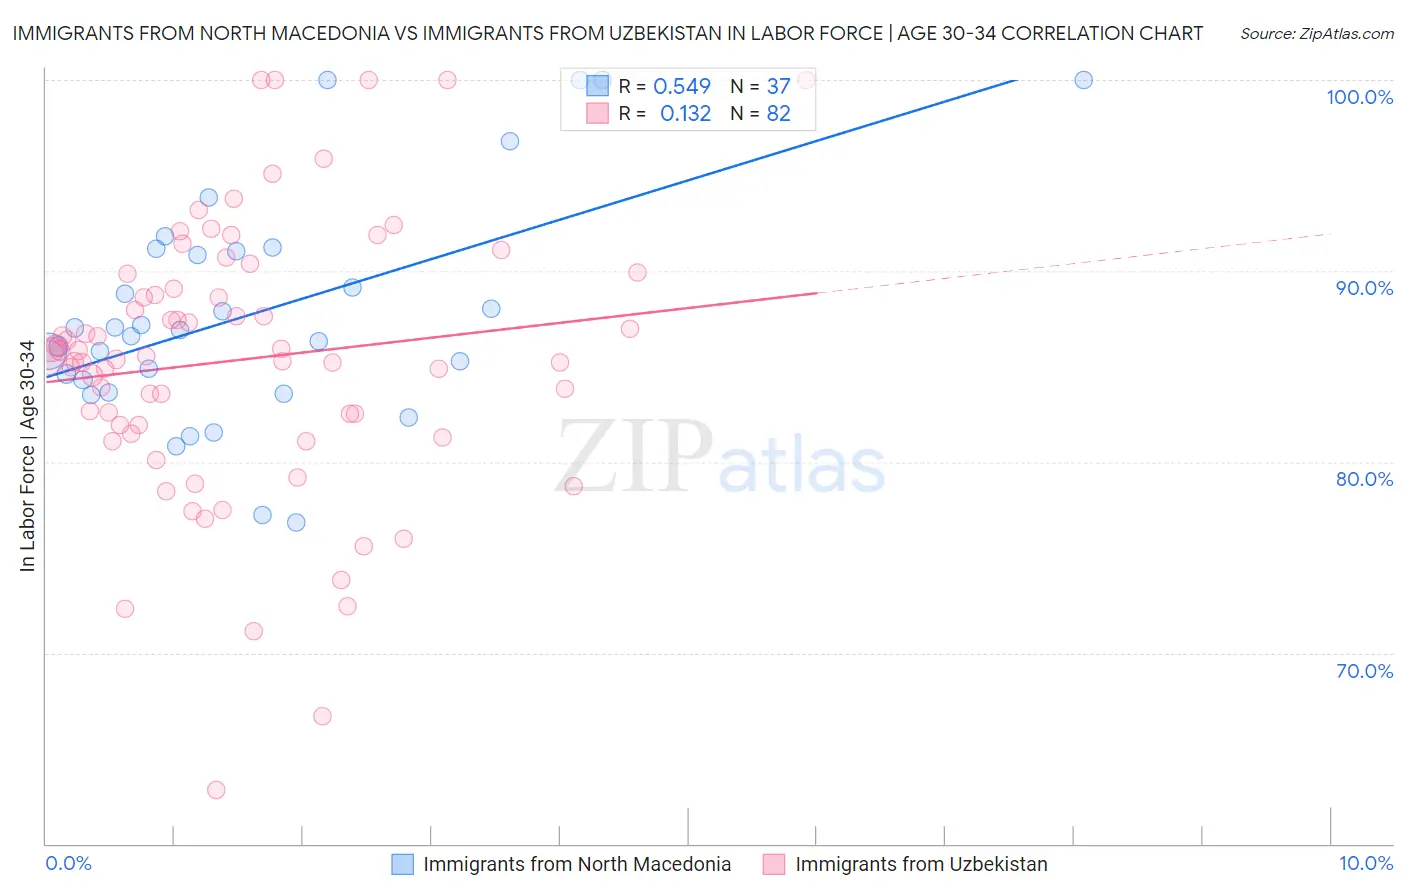
Immigrants from North Macedonia vs Immigrants from Uzbekistan In Labor Force | Age 30-34 Correlation Chart
The statistical analysis conducted on geographies consisting of 74,312,807 people shows a substantial positive correlation between the proportion of Immigrants from North Macedonia and labor force participation rate among population between the ages 30 and 34 in the United States with a correlation coefficient (R) of 0.549 and weighted average of 85.9%. Similarly, the statistical analysis conducted on geographies consisting of 118,740,878 people shows a poor positive correlation between the proportion of Immigrants from Uzbekistan and labor force participation rate among population between the ages 30 and 34 in the United States with a correlation coefficient (R) of 0.132 and weighted average of 84.7%, a difference of 1.5%.
In Labor Force | Age 30-34 Correlation Summary
| Measurement | Immigrants from North Macedonia | Immigrants from Uzbekistan |
| Minimum | 76.8% | 62.8% |
| Maximum | 100.0% | 100.0% |
| Range | 23.2% | 37.2% |
| Mean | 87.8% | 85.3% |
| Median | 86.9% | 85.5% |
| Interquartile 25% (IQ1) | 83.9% | 81.9% |
| Interquartile 75% (IQ3) | 91.1% | 89.1% |
| Interquartile Range (IQR) | 7.2% | 7.2% |
| Standard Deviation (Sample) | 6.0% | 7.1% |
| Standard Deviation (Population) | 5.9% | 7.1% |
Similar Demographics by In Labor Force | Age 30-34
Demographics Similar to Immigrants from North Macedonia by In Labor Force | Age 30-34
In terms of in labor force | age 30-34, the demographic groups most similar to Immigrants from North Macedonia are Immigrants from Eritrea (85.9%, a difference of 0.010%), Immigrants from Eastern Africa (85.9%, a difference of 0.010%), Bermudan (85.9%, a difference of 0.020%), Estonian (85.9%, a difference of 0.020%), and Immigrants from Liberia (85.9%, a difference of 0.030%).
| Demographics | Rating | Rank | In Labor Force | Age 30-34 |
| Immigrants | Sierra Leone | 100.0 /100 | #18 | Exceptional 86.0% |
| Sierra Leoneans | 100.0 /100 | #19 | Exceptional 86.0% |
| Bulgarians | 100.0 /100 | #20 | Exceptional 86.0% |
| Immigrants | Bulgaria | 100.0 /100 | #21 | Exceptional 86.0% |
| Bermudans | 100.0 /100 | #22 | Exceptional 85.9% |
| Estonians | 100.0 /100 | #23 | Exceptional 85.9% |
| Immigrants | Eritrea | 100.0 /100 | #24 | Exceptional 85.9% |
| Immigrants | North Macedonia | 100.0 /100 | #25 | Exceptional 85.9% |
| Immigrants | Eastern Africa | 100.0 /100 | #26 | Exceptional 85.9% |
| Immigrants | Liberia | 100.0 /100 | #27 | Exceptional 85.9% |
| Immigrants | Latvia | 100.0 /100 | #28 | Exceptional 85.9% |
| Tsimshian | 100.0 /100 | #29 | Exceptional 85.8% |
| Immigrants | Hong Kong | 100.0 /100 | #30 | Exceptional 85.8% |
| Paraguayans | 99.9 /100 | #31 | Exceptional 85.8% |
| Cypriots | 99.9 /100 | #32 | Exceptional 85.8% |
Demographics Similar to Immigrants from Uzbekistan by In Labor Force | Age 30-34
In terms of in labor force | age 30-34, the demographic groups most similar to Immigrants from Uzbekistan are Israeli (84.7%, a difference of 0.010%), Finnish (84.7%, a difference of 0.010%), Immigrants from South America (84.7%, a difference of 0.010%), South American Indian (84.7%, a difference of 0.020%), and Immigrants from Burma/Myanmar (84.7%, a difference of 0.020%).
| Demographics | Rating | Rank | In Labor Force | Age 30-34 |
| South American Indians | 52.1 /100 | #169 | Average 84.7% |
| Immigrants | Burma/Myanmar | 52.0 /100 | #170 | Average 84.7% |
| Irish | 52.0 /100 | #171 | Average 84.7% |
| Immigrants | England | 51.7 /100 | #172 | Average 84.7% |
| Israelis | 51.1 /100 | #173 | Average 84.7% |
| Finns | 50.0 /100 | #174 | Average 84.7% |
| Immigrants | South America | 50.0 /100 | #175 | Average 84.7% |
| Immigrants | Uzbekistan | 49.1 /100 | #176 | Average 84.7% |
| Laotians | 46.9 /100 | #177 | Average 84.7% |
| Okinawans | 44.1 /100 | #178 | Average 84.6% |
| Immigrants | Nigeria | 42.5 /100 | #179 | Average 84.6% |
| Immigrants | Netherlands | 42.1 /100 | #180 | Average 84.6% |
| Moroccans | 40.3 /100 | #181 | Average 84.6% |
| Barbadians | 36.7 /100 | #182 | Fair 84.6% |
| Immigrants | Canada | 35.0 /100 | #183 | Fair 84.6% |