Native/Alaskan vs Immigrants from Czechoslovakia In Labor Force | Age 16-19
COMPARE
Native/Alaskan
Immigrants from Czechoslovakia
In Labor Force | Age 16-19
In Labor Force | Age 16-19 Comparison
Natives/Alaskans
Immigrants from Czechoslovakia
36.6%
IN LABOR FORCE | AGE 16-19
49.0/ 100
METRIC RATING
175th/ 347
METRIC RANK
36.6%
IN LABOR FORCE | AGE 16-19
50.0/ 100
METRIC RATING
174th/ 347
METRIC RANK
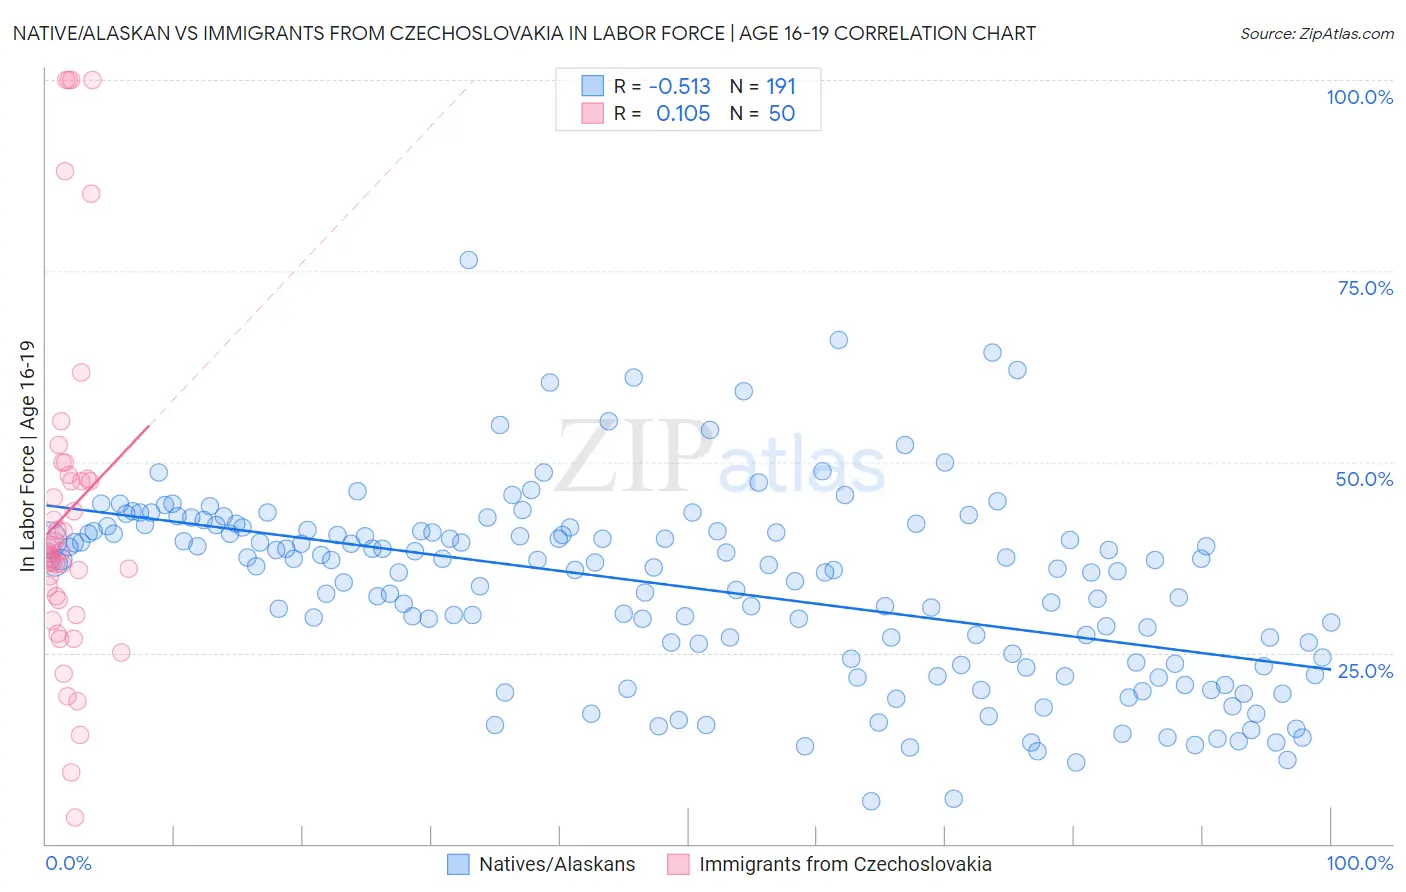
Native/Alaskan vs Immigrants from Czechoslovakia In Labor Force | Age 16-19 Correlation Chart
The statistical analysis conducted on geographies consisting of 511,038,872 people shows a substantial negative correlation between the proportion of Natives/Alaskans and labor force participation rate among population between the ages 16 and 19 in the United States with a correlation coefficient (R) of -0.513 and weighted average of 36.6%. Similarly, the statistical analysis conducted on geographies consisting of 195,231,062 people shows a poor positive correlation between the proportion of Immigrants from Czechoslovakia and labor force participation rate among population between the ages 16 and 19 in the United States with a correlation coefficient (R) of 0.105 and weighted average of 36.6%, a difference of 0.050%.
In Labor Force | Age 16-19 Correlation Summary
| Measurement | Native/Alaskan | Immigrants from Czechoslovakia |
| Minimum | 5.5% | 3.5% |
| Maximum | 76.4% | 100.0% |
| Range | 70.9% | 96.5% |
| Mean | 33.6% | 43.4% |
| Median | 36.4% | 38.2% |
| Interquartile 25% (IQ1) | 23.7% | 31.9% |
| Interquartile 75% (IQ3) | 41.0% | 47.8% |
| Interquartile Range (IQR) | 17.3% | 15.9% |
| Standard Deviation (Sample) | 12.4% | 22.6% |
| Standard Deviation (Population) | 12.3% | 22.3% |
Demographics Similar to Natives/Alaskans and Immigrants from Czechoslovakia by In Labor Force | Age 16-19
In terms of in labor force | age 16-19, the demographic groups most similar to Natives/Alaskans are Albanian (36.5%, a difference of 0.010%), Immigrants from Northern Europe (36.5%, a difference of 0.12%), Black/African American (36.5%, a difference of 0.20%), Immigrants from Southern Europe (36.4%, a difference of 0.29%), and Immigrants from Morocco (36.4%, a difference of 0.41%). Similarly, the demographic groups most similar to Immigrants from Czechoslovakia are Albanian (36.5%, a difference of 0.060%), Immigrants from Northern Europe (36.5%, a difference of 0.17%), Black/African American (36.5%, a difference of 0.25%), Immigrants from Southern Europe (36.4%, a difference of 0.34%), and Russian (36.7%, a difference of 0.38%).
| Demographics | Rating | Rank | In Labor Force | Age 16-19 |
| Immigrants | Kuwait | 68.9 /100 | #164 | Good 36.9% |
| Yakama | 66.9 /100 | #165 | Good 36.9% |
| Immigrants | Western Africa | 66.7 /100 | #166 | Good 36.9% |
| Arabs | 63.6 /100 | #167 | Good 36.8% |
| Palestinians | 63.1 /100 | #168 | Good 36.8% |
| Immigrants | Latvia | 61.6 /100 | #169 | Good 36.8% |
| Immigrants | South Africa | 60.5 /100 | #170 | Good 36.8% |
| Immigrants | Cambodia | 58.4 /100 | #171 | Average 36.7% |
| South Africans | 58.3 /100 | #172 | Average 36.7% |
| Russians | 57.5 /100 | #173 | Average 36.7% |
| Immigrants | Czechoslovakia | 50.0 /100 | #174 | Average 36.6% |
| Natives/Alaskans | 49.0 /100 | #175 | Average 36.6% |
| Albanians | 48.8 /100 | #176 | Average 36.5% |
| Immigrants | Northern Europe | 46.6 /100 | #177 | Average 36.5% |
| Blacks/African Americans | 45.1 /100 | #178 | Average 36.5% |
| Immigrants | Southern Europe | 43.3 /100 | #179 | Average 36.4% |
| Immigrants | Morocco | 41.1 /100 | #180 | Average 36.4% |
| Jordanians | 39.6 /100 | #181 | Fair 36.4% |
| Immigrants | Italy | 39.1 /100 | #182 | Fair 36.4% |
| Eastern Europeans | 38.8 /100 | #183 | Fair 36.4% |
| Costa Ricans | 36.1 /100 | #184 | Fair 36.3% |