Immigrants from Cuba vs Spaniard In Labor Force | Age 16-19
COMPARE
Immigrants from Cuba
Spaniard
In Labor Force | Age 16-19
In Labor Force | Age 16-19 Comparison
Immigrants from Cuba
Spaniards
30.2%
IN LABOR FORCE | AGE 16-19
0.0/ 100
METRIC RATING
335th/ 347
METRIC RANK
38.0%
IN LABOR FORCE | AGE 16-19
95.5/ 100
METRIC RATING
129th/ 347
METRIC RANK
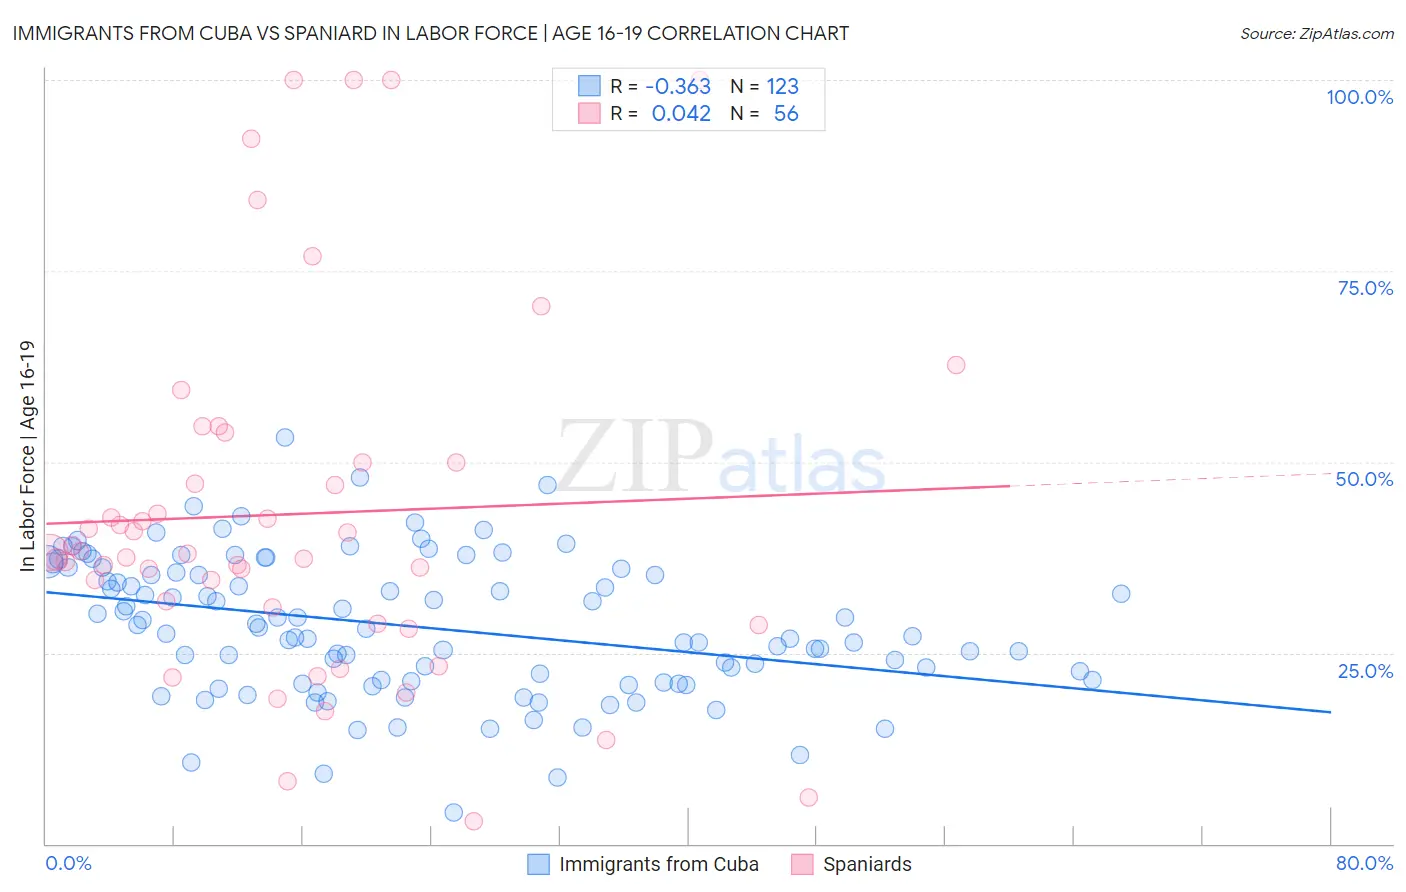
Immigrants from Cuba vs Spaniard In Labor Force | Age 16-19 Correlation Chart
The statistical analysis conducted on geographies consisting of 325,558,601 people shows a mild negative correlation between the proportion of Immigrants from Cuba and labor force participation rate among population between the ages 16 and 19 in the United States with a correlation coefficient (R) of -0.363 and weighted average of 30.2%. Similarly, the statistical analysis conducted on geographies consisting of 442,456,535 people shows no correlation between the proportion of Spaniards and labor force participation rate among population between the ages 16 and 19 in the United States with a correlation coefficient (R) of 0.042 and weighted average of 38.0%, a difference of 25.6%.
In Labor Force | Age 16-19 Correlation Summary
| Measurement | Immigrants from Cuba | Spaniard |
| Minimum | 4.1% | 3.0% |
| Maximum | 53.2% | 100.0% |
| Range | 49.1% | 97.0% |
| Mean | 28.4% | 43.2% |
| Median | 28.1% | 38.1% |
| Interquartile 25% (IQ1) | 21.2% | 29.9% |
| Interquartile 75% (IQ3) | 36.0% | 50.0% |
| Interquartile Range (IQR) | 14.8% | 20.1% |
| Standard Deviation (Sample) | 9.1% | 23.4% |
| Standard Deviation (Population) | 9.0% | 23.2% |
Similar Demographics by In Labor Force | Age 16-19
Demographics Similar to Immigrants from Cuba by In Labor Force | Age 16-19
In terms of in labor force | age 16-19, the demographic groups most similar to Immigrants from Cuba are Immigrants from Trinidad and Tobago (30.2%, a difference of 0.29%), Puerto Rican (30.3%, a difference of 0.33%), Immigrants from Bangladesh (30.0%, a difference of 0.66%), Immigrants from Hong Kong (30.5%, a difference of 0.75%), and Immigrants from Israel (30.5%, a difference of 0.77%).
| Demographics | Rating | Rank | In Labor Force | Age 16-19 |
| Immigrants | Ecuador | 0.0 /100 | #328 | Tragic 31.0% |
| Barbadians | 0.0 /100 | #329 | Tragic 31.0% |
| Lumbee | 0.0 /100 | #330 | Tragic 31.0% |
| Trinidadians and Tobagonians | 0.0 /100 | #331 | Tragic 30.9% |
| Immigrants | Israel | 0.0 /100 | #332 | Tragic 30.5% |
| Immigrants | Hong Kong | 0.0 /100 | #333 | Tragic 30.5% |
| Puerto Ricans | 0.0 /100 | #334 | Tragic 30.3% |
| Immigrants | Cuba | 0.0 /100 | #335 | Tragic 30.2% |
| Immigrants | Trinidad and Tobago | 0.0 /100 | #336 | Tragic 30.2% |
| Immigrants | Bangladesh | 0.0 /100 | #337 | Tragic 30.0% |
| Vietnamese | 0.0 /100 | #338 | Tragic 29.6% |
| Immigrants | Uzbekistan | 0.0 /100 | #339 | Tragic 29.2% |
| British West Indians | 0.0 /100 | #340 | Tragic 29.1% |
| Immigrants | Armenia | 0.0 /100 | #341 | Tragic 29.0% |
| Immigrants | Barbados | 0.0 /100 | #342 | Tragic 29.0% |
Demographics Similar to Spaniards by In Labor Force | Age 16-19
In terms of in labor force | age 16-19, the demographic groups most similar to Spaniards are New Zealander (38.0%, a difference of 0.020%), African (38.0%, a difference of 0.030%), Choctaw (38.0%, a difference of 0.030%), Immigrants from Zimbabwe (38.0%, a difference of 0.030%), and Immigrants from Austria (37.9%, a difference of 0.12%).
| Demographics | Rating | Rank | In Labor Force | Age 16-19 |
| Guamanians/Chamorros | 97.4 /100 | #122 | Exceptional 38.2% |
| Seminole | 96.7 /100 | #123 | Exceptional 38.1% |
| Immigrants | England | 96.4 /100 | #124 | Exceptional 38.1% |
| Immigrants | Africa | 96.1 /100 | #125 | Exceptional 38.0% |
| Africans | 95.6 /100 | #126 | Exceptional 38.0% |
| Choctaw | 95.6 /100 | #127 | Exceptional 38.0% |
| New Zealanders | 95.6 /100 | #128 | Exceptional 38.0% |
| Spaniards | 95.5 /100 | #129 | Exceptional 38.0% |
| Immigrants | Zimbabwe | 95.4 /100 | #130 | Exceptional 38.0% |
| Immigrants | Austria | 95.0 /100 | #131 | Exceptional 37.9% |
| Immigrants | Oceania | 94.7 /100 | #132 | Exceptional 37.9% |
| Cheyenne | 94.6 /100 | #133 | Exceptional 37.9% |
| Immigrants | Netherlands | 93.7 /100 | #134 | Exceptional 37.8% |
| Macedonians | 93.4 /100 | #135 | Exceptional 37.8% |
| Australians | 93.2 /100 | #136 | Exceptional 37.8% |