Native/Alaskan vs Immigrants from Ukraine In Labor Force | Age 20-24
COMPARE
Native/Alaskan
Immigrants from Ukraine
In Labor Force | Age 20-24
In Labor Force | Age 20-24 Comparison
Natives/Alaskans
Immigrants from Ukraine
72.4%
IN LABOR FORCE | AGE 20-24
0.0/ 100
METRIC RATING
302nd/ 347
METRIC RANK
74.2%
IN LABOR FORCE | AGE 20-24
5.1/ 100
METRIC RATING
228th/ 347
METRIC RANK
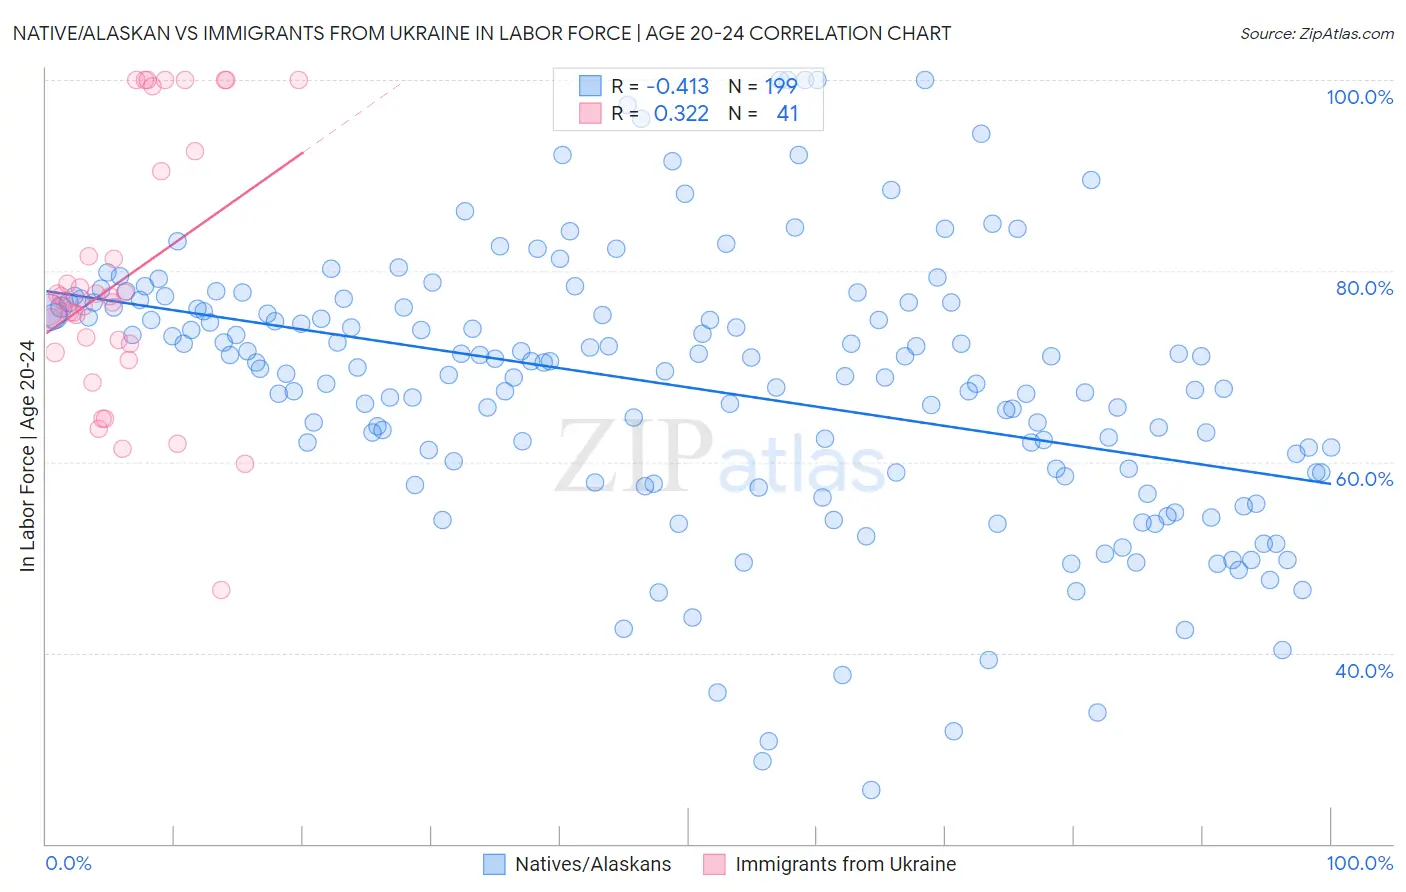
Native/Alaskan vs Immigrants from Ukraine In Labor Force | Age 20-24 Correlation Chart
The statistical analysis conducted on geographies consisting of 512,418,491 people shows a moderate negative correlation between the proportion of Natives/Alaskans and labor force participation rate among population between the ages 20 and 24 in the United States with a correlation coefficient (R) of -0.413 and weighted average of 72.4%. Similarly, the statistical analysis conducted on geographies consisting of 289,649,876 people shows a mild positive correlation between the proportion of Immigrants from Ukraine and labor force participation rate among population between the ages 20 and 24 in the United States with a correlation coefficient (R) of 0.322 and weighted average of 74.2%, a difference of 2.5%.
In Labor Force | Age 20-24 Correlation Summary
| Measurement | Native/Alaskan | Immigrants from Ukraine |
| Minimum | 25.7% | 46.6% |
| Maximum | 100.0% | 100.0% |
| Range | 74.3% | 53.4% |
| Mean | 67.8% | 79.2% |
| Median | 69.8% | 76.9% |
| Interquartile 25% (IQ1) | 58.9% | 71.9% |
| Interquartile 75% (IQ3) | 76.2% | 91.5% |
| Interquartile Range (IQR) | 17.3% | 19.6% |
| Standard Deviation (Sample) | 14.2% | 13.6% |
| Standard Deviation (Population) | 14.2% | 13.4% |
Similar Demographics by In Labor Force | Age 20-24
Demographics Similar to Natives/Alaskans by In Labor Force | Age 20-24
In terms of in labor force | age 20-24, the demographic groups most similar to Natives/Alaskans are Ecuadorian (72.4%, a difference of 0.010%), Immigrants from West Indies (72.4%, a difference of 0.020%), Immigrants from Singapore (72.4%, a difference of 0.050%), Immigrants from Jamaica (72.4%, a difference of 0.070%), and Cuban (72.5%, a difference of 0.090%).
| Demographics | Rating | Rank | In Labor Force | Age 20-24 |
| Okinawans | 0.0 /100 | #295 | Tragic 72.7% |
| Jamaicans | 0.0 /100 | #296 | Tragic 72.7% |
| Central American Indians | 0.0 /100 | #297 | Tragic 72.7% |
| Israelis | 0.0 /100 | #298 | Tragic 72.6% |
| Iranians | 0.0 /100 | #299 | Tragic 72.6% |
| Armenians | 0.0 /100 | #300 | Tragic 72.5% |
| Cubans | 0.0 /100 | #301 | Tragic 72.5% |
| Natives/Alaskans | 0.0 /100 | #302 | Tragic 72.4% |
| Ecuadorians | 0.0 /100 | #303 | Tragic 72.4% |
| Immigrants | West Indies | 0.0 /100 | #304 | Tragic 72.4% |
| Immigrants | Singapore | 0.0 /100 | #305 | Tragic 72.4% |
| Immigrants | Jamaica | 0.0 /100 | #306 | Tragic 72.4% |
| Immigrants | Ecuador | 0.0 /100 | #307 | Tragic 72.3% |
| Soviet Union | 0.0 /100 | #308 | Tragic 72.3% |
| Tsimshian | 0.0 /100 | #309 | Tragic 72.3% |
Demographics Similar to Immigrants from Ukraine by In Labor Force | Age 20-24
In terms of in labor force | age 20-24, the demographic groups most similar to Immigrants from Ukraine are Immigrants from Sweden (74.2%, a difference of 0.040%), Immigrants from Ireland (74.3%, a difference of 0.050%), Immigrants from Fiji (74.3%, a difference of 0.060%), Immigrants from Albania (74.2%, a difference of 0.060%), and Ghanaian (74.3%, a difference of 0.080%).
| Demographics | Rating | Rank | In Labor Force | Age 20-24 |
| Chickasaw | 10.3 /100 | #221 | Poor 74.5% |
| Immigrants | India | 9.9 /100 | #222 | Tragic 74.4% |
| Hispanics or Latinos | 7.9 /100 | #223 | Tragic 74.4% |
| Seminole | 6.9 /100 | #224 | Tragic 74.3% |
| Ghanaians | 6.2 /100 | #225 | Tragic 74.3% |
| Immigrants | Fiji | 5.9 /100 | #226 | Tragic 74.3% |
| Immigrants | Ireland | 5.8 /100 | #227 | Tragic 74.3% |
| Immigrants | Ukraine | 5.1 /100 | #228 | Tragic 74.2% |
| Immigrants | Sweden | 4.6 /100 | #229 | Tragic 74.2% |
| Immigrants | Albania | 4.3 /100 | #230 | Tragic 74.2% |
| Immigrants | Greece | 4.1 /100 | #231 | Tragic 74.2% |
| Immigrants | Switzerland | 4.1 /100 | #232 | Tragic 74.2% |
| Immigrants | Chile | 3.7 /100 | #233 | Tragic 74.1% |
| Immigrants | Immigrants | 3.6 /100 | #234 | Tragic 74.1% |
| Laotians | 3.5 /100 | #235 | Tragic 74.1% |