Native Hawaiian vs Immigrants from Lebanon In Labor Force | Age 20-64
COMPARE
Native Hawaiian
Immigrants from Lebanon
In Labor Force | Age 20-64
In Labor Force | Age 20-64 Comparison
Native Hawaiians
Immigrants from Lebanon
79.1%
IN LABOR FORCE | AGE 20-64
5.6/ 100
METRIC RATING
230th/ 347
METRIC RANK
78.7%
IN LABOR FORCE | AGE 20-64
0.5/ 100
METRIC RATING
254th/ 347
METRIC RANK
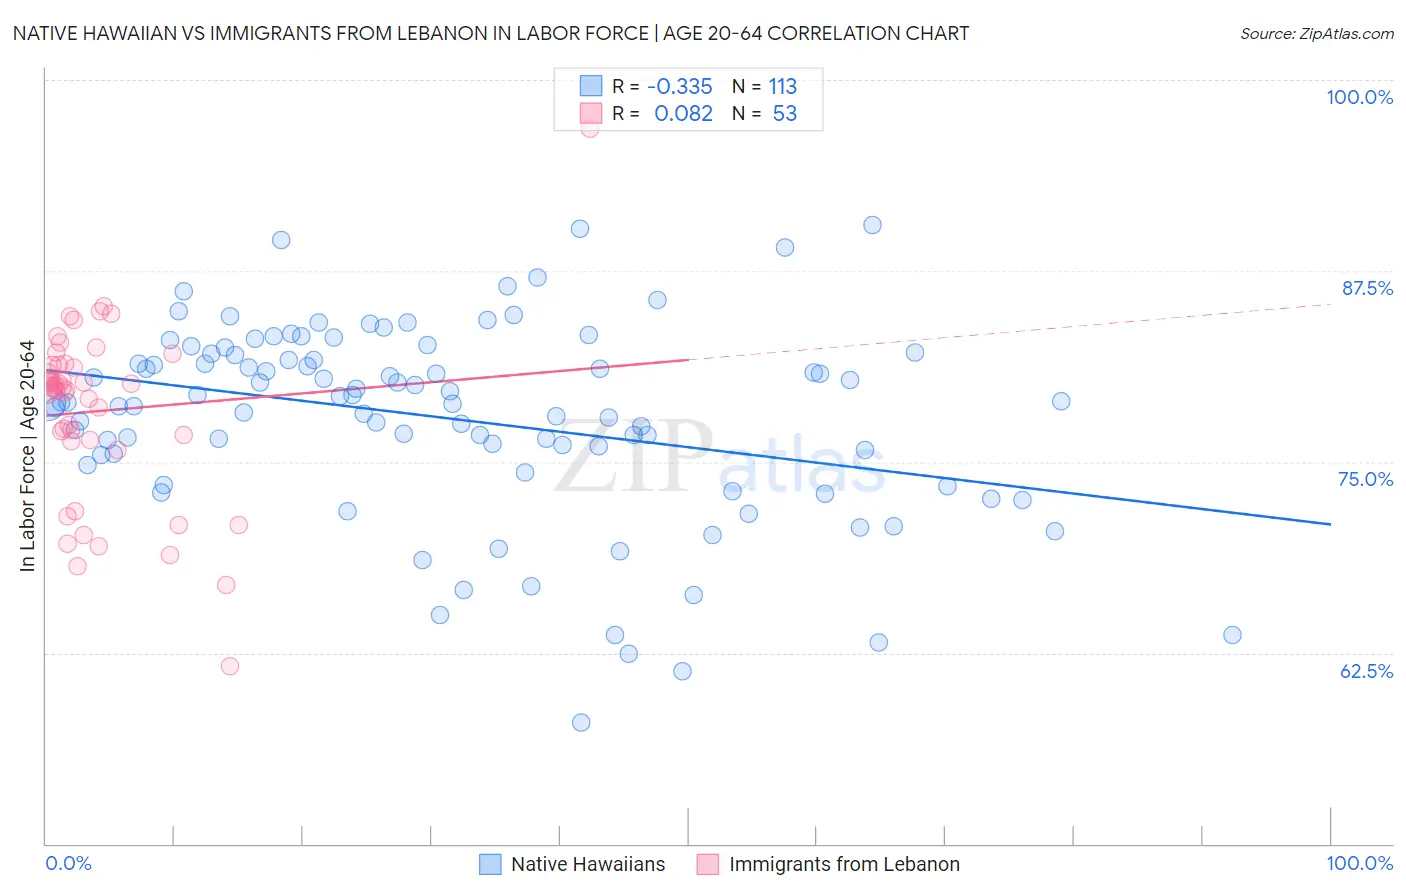
Native Hawaiian vs Immigrants from Lebanon In Labor Force | Age 20-64 Correlation Chart
The statistical analysis conducted on geographies consisting of 332,116,366 people shows a mild negative correlation between the proportion of Native Hawaiians and labor force participation rate among population between the ages 20 and 64 in the United States with a correlation coefficient (R) of -0.335 and weighted average of 79.1%. Similarly, the statistical analysis conducted on geographies consisting of 217,153,550 people shows a slight positive correlation between the proportion of Immigrants from Lebanon and labor force participation rate among population between the ages 20 and 64 in the United States with a correlation coefficient (R) of 0.082 and weighted average of 78.7%, a difference of 0.49%.
In Labor Force | Age 20-64 Correlation Summary
| Measurement | Native Hawaiian | Immigrants from Lebanon |
| Minimum | 57.9% | 61.6% |
| Maximum | 90.5% | 96.8% |
| Range | 32.6% | 35.2% |
| Mean | 77.9% | 78.3% |
| Median | 78.9% | 79.8% |
| Interquartile 25% (IQ1) | 75.1% | 76.4% |
| Interquartile 75% (IQ3) | 82.0% | 81.4% |
| Interquartile Range (IQR) | 6.9% | 5.0% |
| Standard Deviation (Sample) | 6.4% | 5.8% |
| Standard Deviation (Population) | 6.3% | 5.8% |
Similar Demographics by In Labor Force | Age 20-64
Demographics Similar to Native Hawaiians by In Labor Force | Age 20-64
In terms of in labor force | age 20-64, the demographic groups most similar to Native Hawaiians are Panamanian (79.1%, a difference of 0.0%), Alsatian (79.1%, a difference of 0.0%), Central American (79.1%, a difference of 0.010%), Immigrants from Western Europe (79.1%, a difference of 0.010%), and Lebanese (79.1%, a difference of 0.020%).
| Demographics | Rating | Rank | In Labor Force | Age 20-64 |
| Canadians | 6.8 /100 | #223 | Tragic 79.1% |
| Immigrants | Uzbekistan | 6.8 /100 | #224 | Tragic 79.1% |
| Portuguese | 6.4 /100 | #225 | Tragic 79.1% |
| Central Americans | 5.9 /100 | #226 | Tragic 79.1% |
| Immigrants | Western Europe | 5.9 /100 | #227 | Tragic 79.1% |
| Panamanians | 5.7 /100 | #228 | Tragic 79.1% |
| Alsatians | 5.7 /100 | #229 | Tragic 79.1% |
| Native Hawaiians | 5.6 /100 | #230 | Tragic 79.1% |
| Lebanese | 5.1 /100 | #231 | Tragic 79.1% |
| Guamanians/Chamorros | 4.5 /100 | #232 | Tragic 79.1% |
| Japanese | 4.0 /100 | #233 | Tragic 79.1% |
| Immigrants | Canada | 3.2 /100 | #234 | Tragic 79.0% |
| Tlingit-Haida | 3.2 /100 | #235 | Tragic 79.0% |
| Samoans | 2.9 /100 | #236 | Tragic 79.0% |
| Immigrants | North America | 2.9 /100 | #237 | Tragic 79.0% |
Demographics Similar to Immigrants from Lebanon by In Labor Force | Age 20-64
In terms of in labor force | age 20-64, the demographic groups most similar to Immigrants from Lebanon are Basque (78.7%, a difference of 0.0%), Immigrants from Honduras (78.7%, a difference of 0.010%), Hawaiian (78.7%, a difference of 0.020%), Celtic (78.7%, a difference of 0.020%), and Guatemalan (78.7%, a difference of 0.040%).
| Demographics | Rating | Rank | In Labor Force | Age 20-64 |
| Immigrants | Germany | 1.0 /100 | #247 | Tragic 78.8% |
| Immigrants | Caribbean | 1.0 /100 | #248 | Tragic 78.8% |
| English | 0.9 /100 | #249 | Tragic 78.8% |
| Hondurans | 0.8 /100 | #250 | Tragic 78.8% |
| Barbadians | 0.7 /100 | #251 | Tragic 78.8% |
| Immigrants | Honduras | 0.6 /100 | #252 | Tragic 78.7% |
| Basques | 0.5 /100 | #253 | Tragic 78.7% |
| Immigrants | Lebanon | 0.5 /100 | #254 | Tragic 78.7% |
| Hawaiians | 0.5 /100 | #255 | Tragic 78.7% |
| Celtics | 0.5 /100 | #256 | Tragic 78.7% |
| Guatemalans | 0.4 /100 | #257 | Tragic 78.7% |
| Immigrants | Guatemala | 0.4 /100 | #258 | Tragic 78.7% |
| Tsimshian | 0.4 /100 | #259 | Tragic 78.7% |
| Immigrants | Fiji | 0.3 /100 | #260 | Tragic 78.6% |
| Whites/Caucasians | 0.2 /100 | #261 | Tragic 78.5% |