Immigrants from Syria vs Alsatian In Labor Force | Age > 16
COMPARE
Immigrants from Syria
Alsatian
In Labor Force | Age > 16
In Labor Force | Age > 16 Comparison
Immigrants from Syria
Alsatians
65.3%
IN LABOR FORCE | AGE > 16
74.6/ 100
METRIC RATING
159th/ 347
METRIC RANK
64.7%
IN LABOR FORCE | AGE > 16
10.7/ 100
METRIC RATING
218th/ 347
METRIC RANK
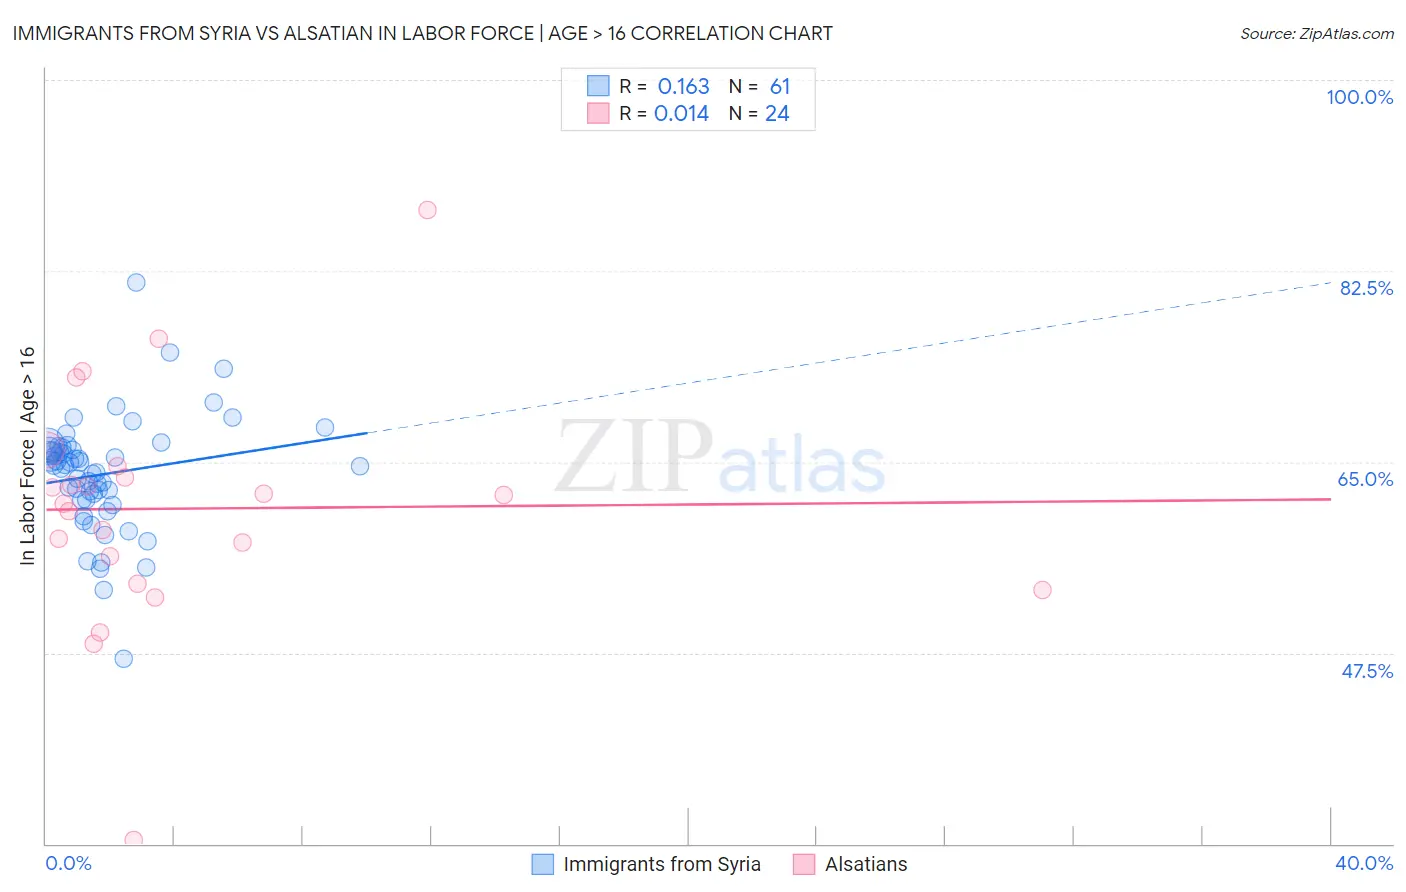
Immigrants from Syria vs Alsatian In Labor Force | Age > 16 Correlation Chart
The statistical analysis conducted on geographies consisting of 174,113,634 people shows a poor positive correlation between the proportion of Immigrants from Syria and labor force participation rate among population ages 16 and over in the United States with a correlation coefficient (R) of 0.163 and weighted average of 65.3%. Similarly, the statistical analysis conducted on geographies consisting of 82,681,658 people shows no correlation between the proportion of Alsatians and labor force participation rate among population ages 16 and over in the United States with a correlation coefficient (R) of 0.014 and weighted average of 64.7%, a difference of 0.90%.
In Labor Force | Age > 16 Correlation Summary
| Measurement | Immigrants from Syria | Alsatian |
| Minimum | 46.9% | 30.3% |
| Maximum | 81.4% | 88.1% |
| Range | 34.5% | 57.8% |
| Mean | 63.9% | 60.7% |
| Median | 64.7% | 61.6% |
| Interquartile 25% (IQ1) | 61.5% | 55.1% |
| Interquartile 75% (IQ3) | 66.2% | 64.1% |
| Interquartile Range (IQR) | 4.7% | 9.0% |
| Standard Deviation (Sample) | 5.3% | 11.0% |
| Standard Deviation (Population) | 5.2% | 10.8% |
Similar Demographics by In Labor Force | Age > 16
Demographics Similar to Immigrants from Syria by In Labor Force | Age > 16
In terms of in labor force | age > 16, the demographic groups most similar to Immigrants from Syria are Panamanian (65.3%, a difference of 0.010%), Immigrants from Ireland (65.3%, a difference of 0.020%), Immigrants from Russia (65.3%, a difference of 0.020%), Immigrants from South Africa (65.3%, a difference of 0.020%), and Immigrants from Armenia (65.3%, a difference of 0.030%).
| Demographics | Rating | Rank | In Labor Force | Age > 16 |
| Yugoslavians | 81.3 /100 | #152 | Excellent 65.4% |
| Immigrants | China | 80.5 /100 | #153 | Excellent 65.4% |
| Immigrants | Eastern Europe | 78.3 /100 | #154 | Good 65.4% |
| Immigrants | Armenia | 76.6 /100 | #155 | Good 65.3% |
| Immigrants | Ireland | 75.9 /100 | #156 | Good 65.3% |
| Immigrants | Russia | 75.7 /100 | #157 | Good 65.3% |
| Panamanians | 75.2 /100 | #158 | Good 65.3% |
| Immigrants | Syria | 74.6 /100 | #159 | Good 65.3% |
| Immigrants | South Africa | 73.5 /100 | #160 | Good 65.3% |
| Australians | 71.3 /100 | #161 | Good 65.3% |
| Albanians | 70.8 /100 | #162 | Good 65.3% |
| South Africans | 69.8 /100 | #163 | Good 65.3% |
| Danes | 68.8 /100 | #164 | Good 65.3% |
| Immigrants | Kazakhstan | 68.1 /100 | #165 | Good 65.3% |
| Immigrants | Western Asia | 67.3 /100 | #166 | Good 65.3% |
Demographics Similar to Alsatians by In Labor Force | Age > 16
In terms of in labor force | age > 16, the demographic groups most similar to Alsatians are Immigrants from Central America (64.7%, a difference of 0.010%), Belgian (64.7%, a difference of 0.020%), U.S. Virgin Islander (64.7%, a difference of 0.020%), Alaska Native (64.7%, a difference of 0.030%), and Immigrants from Micronesia (64.7%, a difference of 0.030%).
| Demographics | Rating | Rank | In Labor Force | Age > 16 |
| Fijians | 14.1 /100 | #211 | Poor 64.8% |
| Alaskan Athabascans | 13.9 /100 | #212 | Poor 64.8% |
| Maltese | 13.8 /100 | #213 | Poor 64.8% |
| Estonians | 13.1 /100 | #214 | Poor 64.8% |
| Immigrants | Czechoslovakia | 12.3 /100 | #215 | Poor 64.8% |
| Belgians | 11.4 /100 | #216 | Poor 64.7% |
| U.S. Virgin Islanders | 11.3 /100 | #217 | Poor 64.7% |
| Alsatians | 10.7 /100 | #218 | Poor 64.7% |
| Immigrants | Central America | 10.5 /100 | #219 | Poor 64.7% |
| Alaska Natives | 9.9 /100 | #220 | Tragic 64.7% |
| Immigrants | Micronesia | 9.6 /100 | #221 | Tragic 64.7% |
| Hawaiians | 9.3 /100 | #222 | Tragic 64.7% |
| Immigrants | Belize | 9.2 /100 | #223 | Tragic 64.7% |
| Immigrants | Jamaica | 8.8 /100 | #224 | Tragic 64.7% |
| Croatians | 8.8 /100 | #225 | Tragic 64.7% |