Immigrants from Laos vs Jordanian In Labor Force | Age 25-29
COMPARE
Immigrants from Laos
Jordanian
In Labor Force | Age 25-29
In Labor Force | Age 25-29 Comparison
Immigrants from Laos
Jordanians
84.8%
IN LABOR FORCE | AGE 25-29
69.0/ 100
METRIC RATING
144th/ 347
METRIC RANK
84.2%
IN LABOR FORCE | AGE 25-29
6.7/ 100
METRIC RATING
222nd/ 347
METRIC RANK
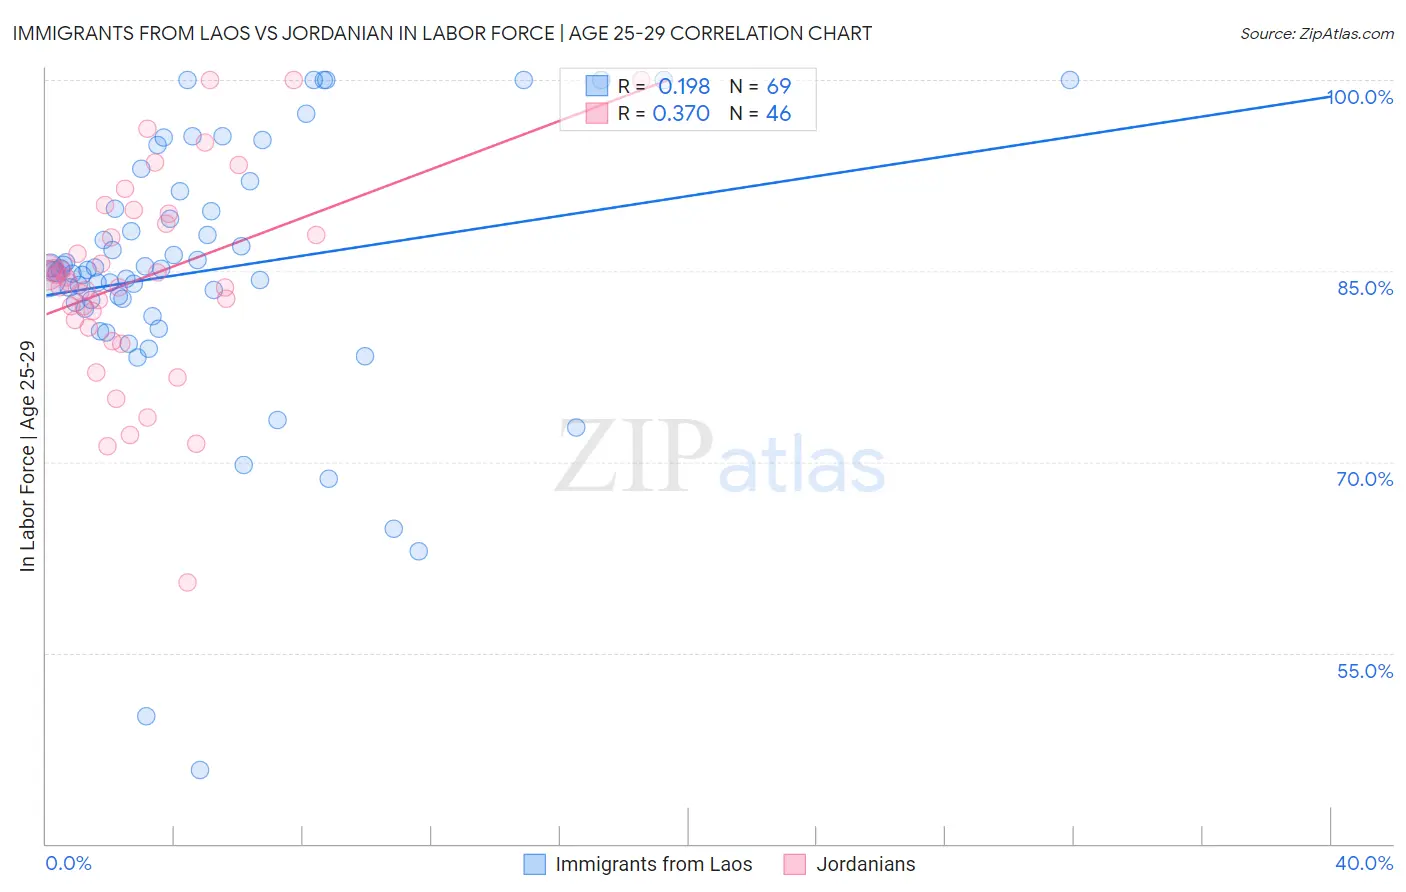
Immigrants from Laos vs Jordanian In Labor Force | Age 25-29 Correlation Chart
The statistical analysis conducted on geographies consisting of 201,457,700 people shows a poor positive correlation between the proportion of Immigrants from Laos and labor force participation rate among population between the ages 25 and 29 in the United States with a correlation coefficient (R) of 0.198 and weighted average of 84.8%. Similarly, the statistical analysis conducted on geographies consisting of 166,391,810 people shows a mild positive correlation between the proportion of Jordanians and labor force participation rate among population between the ages 25 and 29 in the United States with a correlation coefficient (R) of 0.370 and weighted average of 84.2%, a difference of 0.63%.
In Labor Force | Age 25-29 Correlation Summary
| Measurement | Immigrants from Laos | Jordanian |
| Minimum | 45.8% | 60.5% |
| Maximum | 100.0% | 100.0% |
| Range | 54.2% | 39.5% |
| Mean | 85.0% | 84.4% |
| Median | 85.1% | 84.3% |
| Interquartile 25% (IQ1) | 82.3% | 81.2% |
| Interquartile 75% (IQ3) | 90.6% | 88.8% |
| Interquartile Range (IQR) | 8.3% | 7.6% |
| Standard Deviation (Sample) | 10.5% | 7.9% |
| Standard Deviation (Population) | 10.4% | 7.8% |
Similar Demographics by In Labor Force | Age 25-29
Demographics Similar to Immigrants from Laos by In Labor Force | Age 25-29
In terms of in labor force | age 25-29, the demographic groups most similar to Immigrants from Laos are Sri Lankan (84.8%, a difference of 0.0%), Pakistani (84.8%, a difference of 0.010%), Immigrants from Senegal (84.8%, a difference of 0.010%), Icelander (84.8%, a difference of 0.010%), and Immigrants from Asia (84.8%, a difference of 0.010%).
| Demographics | Rating | Rank | In Labor Force | Age 25-29 |
| Immigrants | Canada | 73.5 /100 | #137 | Good 84.8% |
| Armenians | 72.7 /100 | #138 | Good 84.8% |
| Immigrants | Eastern Asia | 72.6 /100 | #139 | Good 84.8% |
| Immigrants | North America | 72.1 /100 | #140 | Good 84.8% |
| Danes | 71.9 /100 | #141 | Good 84.8% |
| Pakistanis | 70.0 /100 | #142 | Good 84.8% |
| Sri Lankans | 69.2 /100 | #143 | Good 84.8% |
| Immigrants | Laos | 69.0 /100 | #144 | Good 84.8% |
| Immigrants | Senegal | 68.3 /100 | #145 | Good 84.8% |
| Icelanders | 68.2 /100 | #146 | Good 84.8% |
| Immigrants | Asia | 68.2 /100 | #147 | Good 84.8% |
| Immigrants | England | 65.2 /100 | #148 | Good 84.7% |
| Peruvians | 64.7 /100 | #149 | Good 84.7% |
| Swiss | 64.7 /100 | #150 | Good 84.7% |
| Colombians | 62.8 /100 | #151 | Good 84.7% |
Demographics Similar to Jordanians by In Labor Force | Age 25-29
In terms of in labor force | age 25-29, the demographic groups most similar to Jordanians are Arab (84.2%, a difference of 0.0%), Nigerian (84.3%, a difference of 0.010%), Scotch-Irish (84.2%, a difference of 0.010%), Immigrants from West Indies (84.2%, a difference of 0.020%), and Korean (84.2%, a difference of 0.030%).
| Demographics | Rating | Rank | In Labor Force | Age 25-29 |
| Immigrants | Syria | 10.7 /100 | #215 | Poor 84.3% |
| Israelis | 9.3 /100 | #216 | Tragic 84.3% |
| Immigrants | Ecuador | 9.3 /100 | #217 | Tragic 84.3% |
| Immigrants | Nigeria | 9.0 /100 | #218 | Tragic 84.3% |
| Immigrants | Saudi Arabia | 8.8 /100 | #219 | Tragic 84.3% |
| Nigerians | 7.2 /100 | #220 | Tragic 84.3% |
| Arabs | 6.8 /100 | #221 | Tragic 84.2% |
| Jordanians | 6.7 /100 | #222 | Tragic 84.2% |
| Scotch-Irish | 6.5 /100 | #223 | Tragic 84.2% |
| Immigrants | West Indies | 6.0 /100 | #224 | Tragic 84.2% |
| Koreans | 5.9 /100 | #225 | Tragic 84.2% |
| Immigrants | Congo | 5.8 /100 | #226 | Tragic 84.2% |
| French American Indians | 5.5 /100 | #227 | Tragic 84.2% |
| Immigrants | Panama | 5.5 /100 | #228 | Tragic 84.2% |
| Immigrants | Oceania | 5.0 /100 | #229 | Tragic 84.2% |