Moroccan vs Immigrants from Sweden Householder Income Under 25 years
COMPARE
Moroccan
Immigrants from Sweden
Householder Income Under 25 years
Householder Income Under 25 years Comparison
Moroccans
Immigrants from Sweden
$53,256
HOUSEHOLDER INCOME UNDER 25 YEARS
93.1/ 100
METRIC RATING
132nd/ 347
METRIC RANK
$53,621
HOUSEHOLDER INCOME UNDER 25 YEARS
97.1/ 100
METRIC RATING
114th/ 347
METRIC RANK
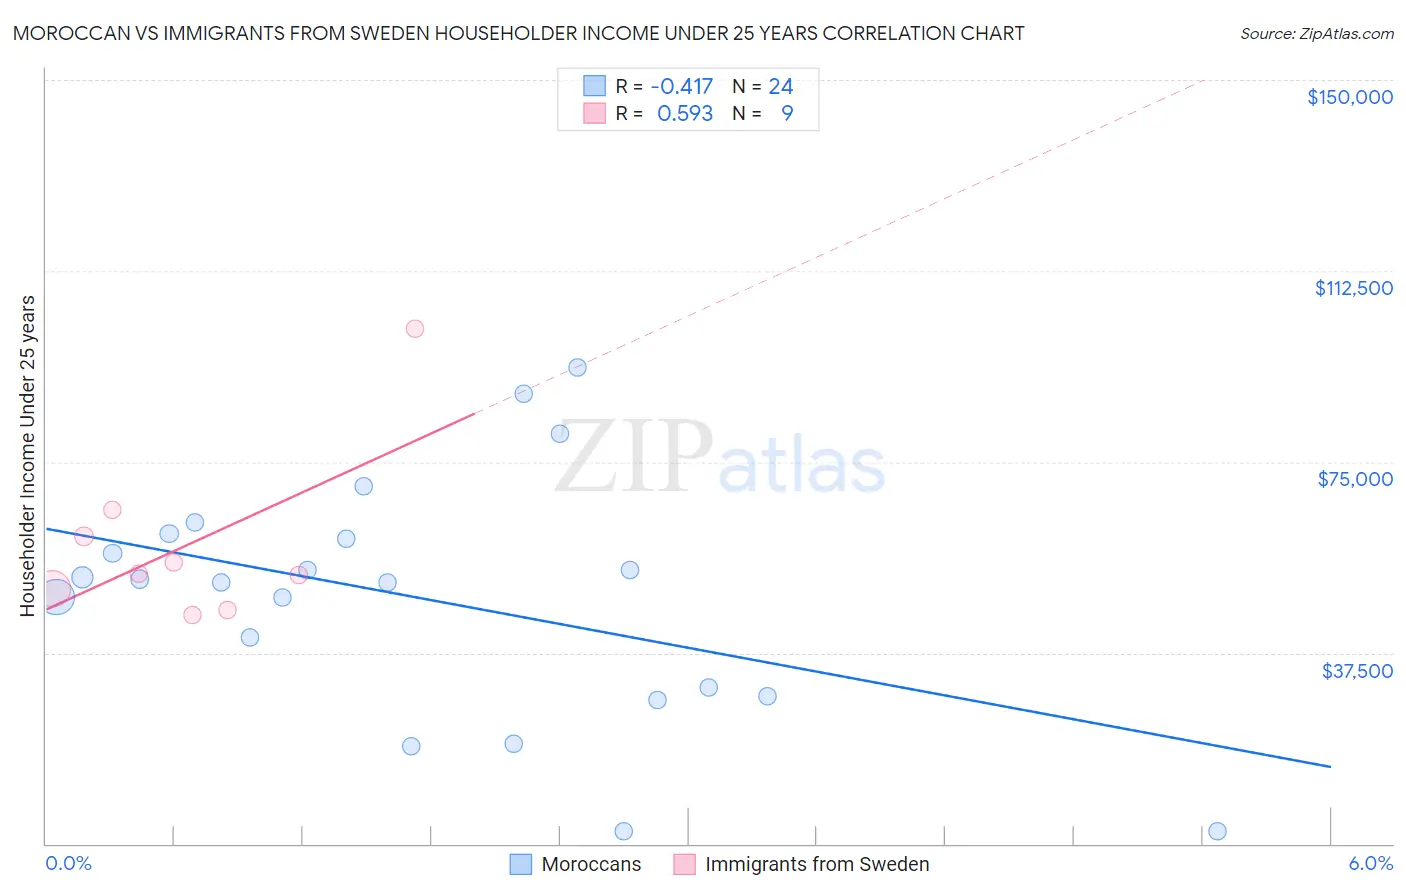
Moroccan vs Immigrants from Sweden Householder Income Under 25 years Correlation Chart
The statistical analysis conducted on geographies consisting of 180,752,865 people shows a moderate negative correlation between the proportion of Moroccans and household income with householder under the age of 25 in the United States with a correlation coefficient (R) of -0.417 and weighted average of $53,256. Similarly, the statistical analysis conducted on geographies consisting of 146,742,584 people shows a substantial positive correlation between the proportion of Immigrants from Sweden and household income with householder under the age of 25 in the United States with a correlation coefficient (R) of 0.593 and weighted average of $53,621, a difference of 0.68%.
Householder Income Under 25 years Correlation Summary
| Measurement | Moroccan | Immigrants from Sweden |
| Minimum | $2,499 | $44,957 |
| Maximum | $93,569 | $101,141 |
| Range | $91,070 | $56,184 |
| Mean | $48,217 | $58,786 |
| Median | $51,677 | $52,949 |
| Interquartile 25% (IQ1) | $29,861 | $48,010 |
| Interquartile 75% (IQ3) | $60,431 | $62,961 |
| Interquartile Range (IQR) | $30,570 | $14,951 |
| Standard Deviation (Sample) | $23,674 | $17,165 |
| Standard Deviation (Population) | $23,176 | $16,183 |
Demographics Similar to Moroccans and Immigrants from Sweden by Householder Income Under 25 years
In terms of householder income under 25 years, the demographic groups most similar to Moroccans are Immigrants from Nicaragua ($53,266, a difference of 0.020%), Nicaraguan ($53,275, a difference of 0.030%), New Zealander ($53,294, a difference of 0.070%), Immigrants from Bulgaria ($53,305, a difference of 0.090%), and Immigrants from North America ($53,307, a difference of 0.10%). Similarly, the demographic groups most similar to Immigrants from Sweden are Romanian ($53,632, a difference of 0.020%), Immigrants from Albania ($53,597, a difference of 0.040%), Immigrants from Spain ($53,560, a difference of 0.11%), Lithuanian ($53,552, a difference of 0.13%), and Immigrants from Switzerland ($53,528, a difference of 0.17%).
| Demographics | Rating | Rank | Householder Income Under 25 years |
| Romanians | 97.2 /100 | #113 | Exceptional $53,632 |
| Immigrants | Sweden | 97.1 /100 | #114 | Exceptional $53,621 |
| Immigrants | Albania | 96.9 /100 | #115 | Exceptional $53,597 |
| Immigrants | Spain | 96.6 /100 | #116 | Exceptional $53,560 |
| Lithuanians | 96.6 /100 | #117 | Exceptional $53,552 |
| Immigrants | Switzerland | 96.3 /100 | #118 | Exceptional $53,528 |
| Italians | 95.4 /100 | #119 | Exceptional $53,426 |
| Guamanians/Chamorros | 95.3 /100 | #120 | Exceptional $53,423 |
| Immigrants | Canada | 95.2 /100 | #121 | Exceptional $53,411 |
| Immigrants | Ethiopia | 95.2 /100 | #122 | Exceptional $53,408 |
| Immigrants | Iraq | 94.9 /100 | #123 | Exceptional $53,384 |
| Colombians | 94.6 /100 | #124 | Exceptional $53,357 |
| Pakistanis | 94.1 /100 | #125 | Exceptional $53,325 |
| Immigrants | Serbia | 94.1 /100 | #126 | Exceptional $53,321 |
| Immigrants | North America | 93.9 /100 | #127 | Exceptional $53,307 |
| Immigrants | Bulgaria | 93.9 /100 | #128 | Exceptional $53,305 |
| New Zealanders | 93.7 /100 | #129 | Exceptional $53,294 |
| Nicaraguans | 93.4 /100 | #130 | Exceptional $53,275 |
| Immigrants | Nicaragua | 93.3 /100 | #131 | Exceptional $53,266 |
| Moroccans | 93.1 /100 | #132 | Exceptional $53,256 |
| Immigrants | Immigrants | 92.2 /100 | #133 | Exceptional $53,201 |