Moroccan vs English In Labor Force | Age 45-54
COMPARE
Moroccan
English
In Labor Force | Age 45-54
In Labor Force | Age 45-54 Comparison
Moroccans
English
82.5%
IN LABOR FORCE | AGE 45-54
15.7/ 100
METRIC RATING
199th/ 347
METRIC RANK
82.2%
IN LABOR FORCE | AGE 45-54
4.4/ 100
METRIC RATING
218th/ 347
METRIC RANK
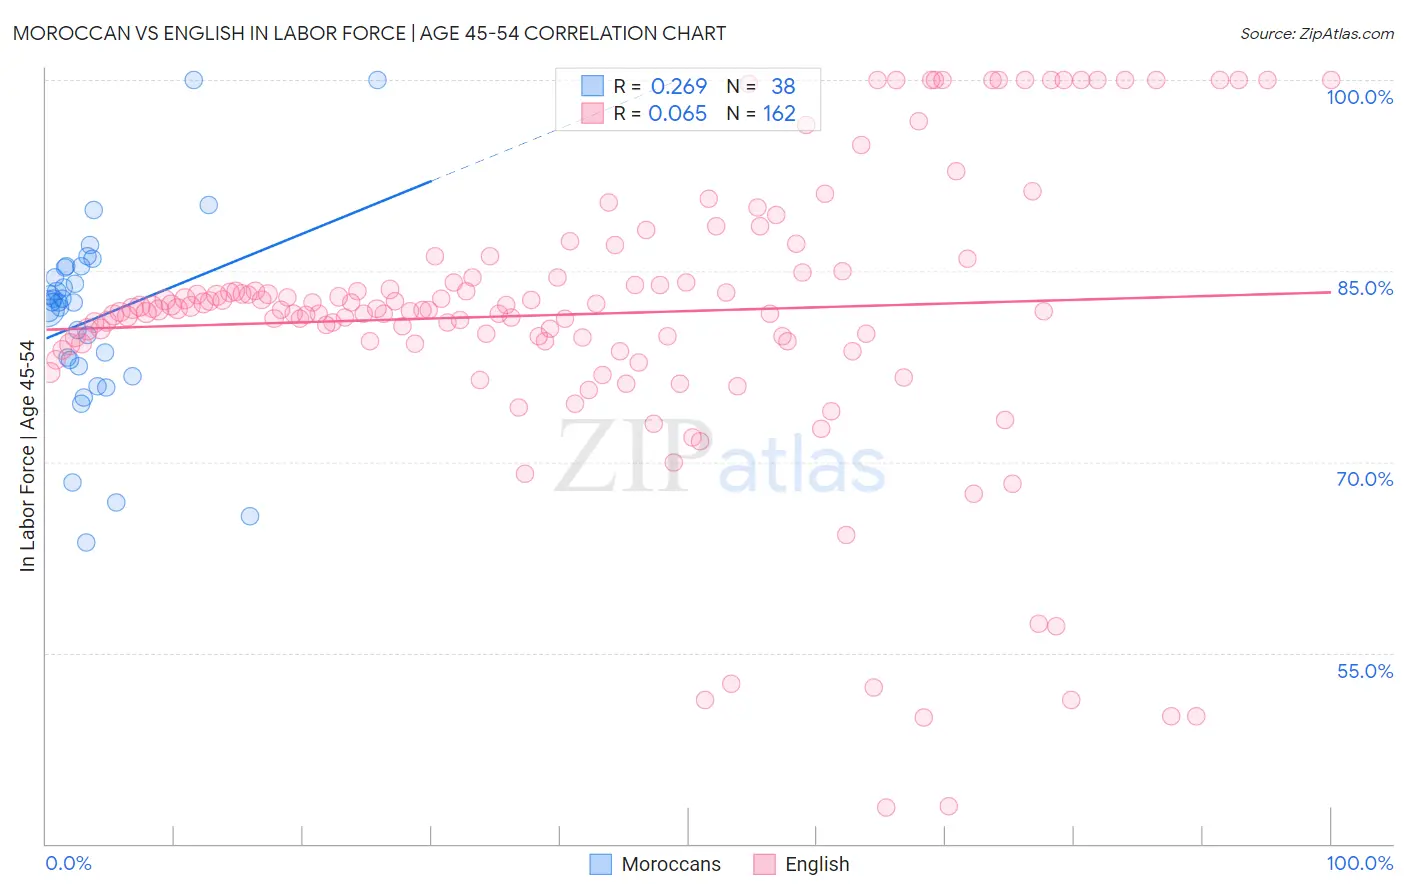
Moroccan vs English In Labor Force | Age 45-54 Correlation Chart
The statistical analysis conducted on geographies consisting of 201,759,404 people shows a weak positive correlation between the proportion of Moroccans and labor force participation rate among population between the ages 45 and 54 in the United States with a correlation coefficient (R) of 0.269 and weighted average of 82.5%. Similarly, the statistical analysis conducted on geographies consisting of 578,921,090 people shows a slight positive correlation between the proportion of English and labor force participation rate among population between the ages 45 and 54 in the United States with a correlation coefficient (R) of 0.065 and weighted average of 82.2%, a difference of 0.31%.
In Labor Force | Age 45-54 Correlation Summary
| Measurement | Moroccan | English |
| Minimum | 63.7% | 42.8% |
| Maximum | 100.0% | 100.0% |
| Range | 36.3% | 57.2% |
| Mean | 81.3% | 81.6% |
| Median | 82.5% | 81.9% |
| Interquartile 25% (IQ1) | 77.6% | 79.5% |
| Interquartile 75% (IQ3) | 85.3% | 84.5% |
| Interquartile Range (IQR) | 7.7% | 5.1% |
| Standard Deviation (Sample) | 7.6% | 11.3% |
| Standard Deviation (Population) | 7.5% | 11.3% |
Demographics Similar to Moroccans and English by In Labor Force | Age 45-54
In terms of in labor force | age 45-54, the demographic groups most similar to Moroccans are French Canadian (82.5%, a difference of 0.0%), Canadian (82.4%, a difference of 0.010%), Immigrants from Western Asia (82.4%, a difference of 0.010%), Immigrants from Denmark (82.5%, a difference of 0.040%), and Arab (82.4%, a difference of 0.080%). Similarly, the demographic groups most similar to English are Portuguese (82.2%, a difference of 0.020%), Scottish (82.2%, a difference of 0.040%), Immigrants from Panama (82.2%, a difference of 0.060%), Iraqi (82.2%, a difference of 0.060%), and Immigrants from Uzbekistan (82.3%, a difference of 0.070%).
| Demographics | Rating | Rank | In Labor Force | Age 45-54 |
| Immigrants | Denmark | 17.9 /100 | #198 | Poor 82.5% |
| Moroccans | 15.7 /100 | #199 | Poor 82.5% |
| French Canadians | 15.4 /100 | #200 | Poor 82.5% |
| Canadians | 15.1 /100 | #201 | Poor 82.4% |
| Immigrants | Western Asia | 14.9 /100 | #202 | Poor 82.4% |
| Arabs | 11.6 /100 | #203 | Poor 82.4% |
| Immigrants | Western Europe | 10.9 /100 | #204 | Poor 82.4% |
| Senegalese | 9.5 /100 | #205 | Tragic 82.4% |
| Welsh | 9.2 /100 | #206 | Tragic 82.3% |
| Immigrants | Cabo Verde | 8.6 /100 | #207 | Tragic 82.3% |
| Native Hawaiians | 8.5 /100 | #208 | Tragic 82.3% |
| Immigrants | Lebanon | 7.4 /100 | #209 | Tragic 82.3% |
| Immigrants | Bahamas | 7.1 /100 | #210 | Tragic 82.3% |
| Immigrants | Syria | 6.6 /100 | #211 | Tragic 82.3% |
| Ecuadorians | 6.3 /100 | #212 | Tragic 82.3% |
| Immigrants | Uzbekistan | 5.8 /100 | #213 | Tragic 82.3% |
| Immigrants | Panama | 5.6 /100 | #214 | Tragic 82.2% |
| Iraqis | 5.6 /100 | #215 | Tragic 82.2% |
| Scottish | 5.3 /100 | #216 | Tragic 82.2% |
| Portuguese | 4.7 /100 | #217 | Tragic 82.2% |
| English | 4.4 /100 | #218 | Tragic 82.2% |