Malaysian vs Immigrants from Cameroon In Labor Force | Age 35-44
COMPARE
Malaysian
Immigrants from Cameroon
In Labor Force | Age 35-44
In Labor Force | Age 35-44 Comparison
Malaysians
Immigrants from Cameroon
83.8%
IN LABOR FORCE | AGE 35-44
1.1/ 100
METRIC RATING
245th/ 347
METRIC RANK
85.8%
IN LABOR FORCE | AGE 35-44
100.0/ 100
METRIC RATING
11th/ 347
METRIC RANK
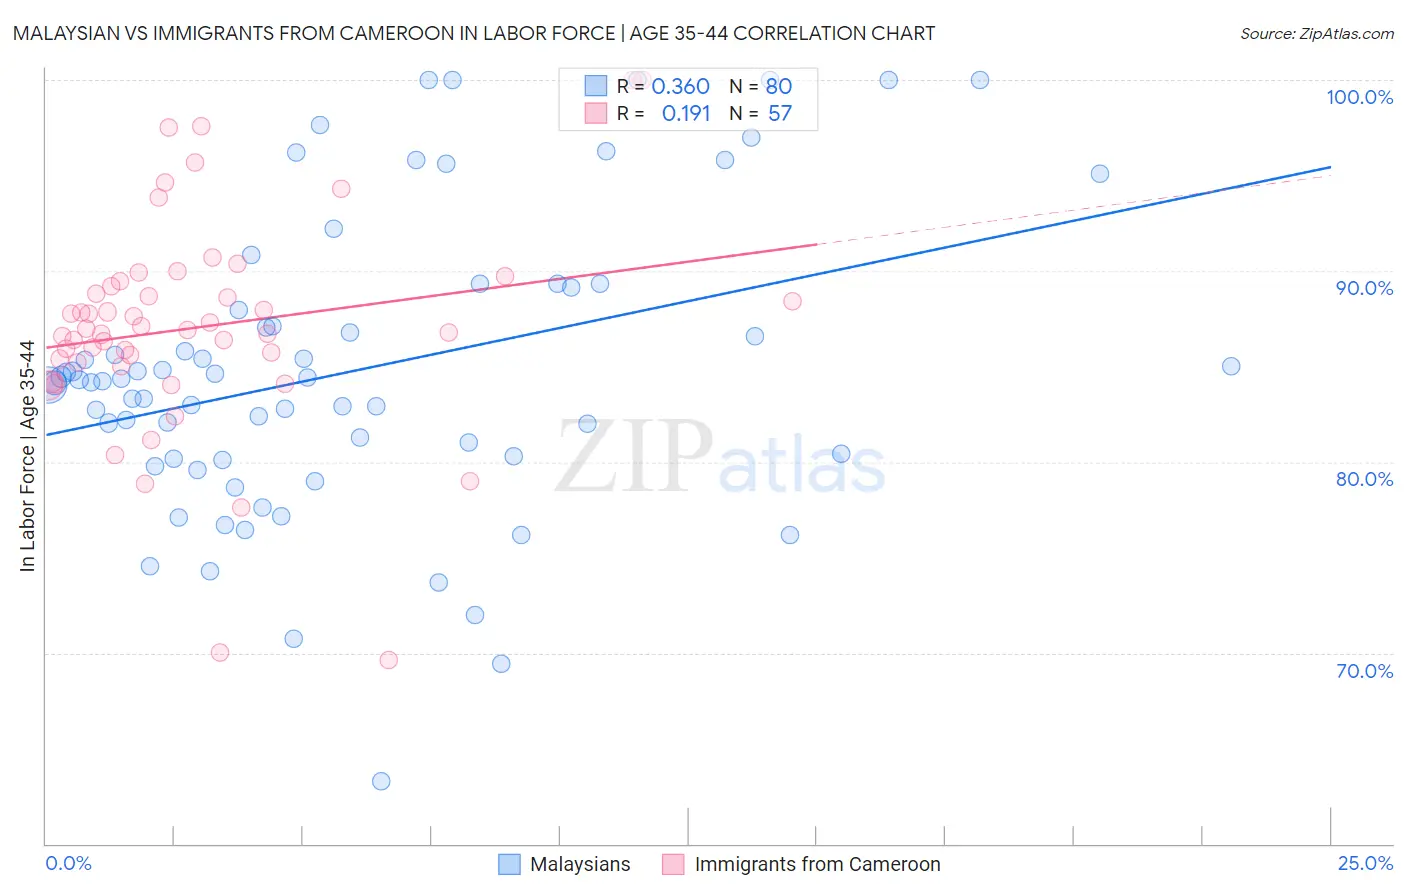
Malaysian vs Immigrants from Cameroon In Labor Force | Age 35-44 Correlation Chart
The statistical analysis conducted on geographies consisting of 226,064,570 people shows a mild positive correlation between the proportion of Malaysians and labor force participation rate among population between the ages 35 and 44 in the United States with a correlation coefficient (R) of 0.360 and weighted average of 83.8%. Similarly, the statistical analysis conducted on geographies consisting of 130,741,497 people shows a poor positive correlation between the proportion of Immigrants from Cameroon and labor force participation rate among population between the ages 35 and 44 in the United States with a correlation coefficient (R) of 0.191 and weighted average of 85.8%, a difference of 2.4%.
In Labor Force | Age 35-44 Correlation Summary
| Measurement | Malaysian | Immigrants from Cameroon |
| Minimum | 63.3% | 69.6% |
| Maximum | 100.0% | 100.0% |
| Range | 36.7% | 30.4% |
| Mean | 84.8% | 87.1% |
| Median | 84.3% | 86.9% |
| Interquartile 25% (IQ1) | 80.2% | 85.1% |
| Interquartile 75% (IQ3) | 88.5% | 89.3% |
| Interquartile Range (IQR) | 8.3% | 4.2% |
| Standard Deviation (Sample) | 7.8% | 5.7% |
| Standard Deviation (Population) | 7.7% | 5.7% |
Similar Demographics by In Labor Force | Age 35-44
Demographics Similar to Malaysians by In Labor Force | Age 35-44
In terms of in labor force | age 35-44, the demographic groups most similar to Malaysians are Immigrants from Western Asia (83.8%, a difference of 0.0%), Guyanese (83.8%, a difference of 0.0%), Immigrants from Cambodia (83.8%, a difference of 0.010%), Immigrants (83.7%, a difference of 0.010%), and Arab (83.8%, a difference of 0.030%).
| Demographics | Rating | Rank | In Labor Force | Age 35-44 |
| Immigrants | Laos | 1.7 /100 | #238 | Tragic 83.8% |
| Celtics | 1.4 /100 | #239 | Tragic 83.8% |
| Arabs | 1.3 /100 | #240 | Tragic 83.8% |
| Iraqis | 1.3 /100 | #241 | Tragic 83.8% |
| Immigrants | Cambodia | 1.1 /100 | #242 | Tragic 83.8% |
| Immigrants | Western Asia | 1.1 /100 | #243 | Tragic 83.8% |
| Guyanese | 1.1 /100 | #244 | Tragic 83.8% |
| Malaysians | 1.1 /100 | #245 | Tragic 83.8% |
| Immigrants | Immigrants | 1.0 /100 | #246 | Tragic 83.7% |
| Immigrants | Armenia | 0.9 /100 | #247 | Tragic 83.7% |
| Indonesians | 0.8 /100 | #248 | Tragic 83.7% |
| Immigrants | St. Vincent and the Grenadines | 0.7 /100 | #249 | Tragic 83.7% |
| Whites/Caucasians | 0.5 /100 | #250 | Tragic 83.6% |
| Salvadorans | 0.4 /100 | #251 | Tragic 83.6% |
| Immigrants | Guyana | 0.4 /100 | #252 | Tragic 83.6% |
Demographics Similar to Immigrants from Cameroon by In Labor Force | Age 35-44
In terms of in labor force | age 35-44, the demographic groups most similar to Immigrants from Cameroon are Cape Verdean (85.8%, a difference of 0.030%), Liberian (85.7%, a difference of 0.12%), Somali (85.6%, a difference of 0.14%), Immigrants from Somalia (85.6%, a difference of 0.14%), and Immigrants from Ethiopia (85.9%, a difference of 0.16%).
| Demographics | Rating | Rank | In Labor Force | Age 35-44 |
| Immigrants | Cabo Verde | 100.0 /100 | #4 | Exceptional 86.2% |
| Zimbabweans | 100.0 /100 | #5 | Exceptional 86.1% |
| Bolivians | 100.0 /100 | #6 | Exceptional 86.1% |
| Immigrants | Sierra Leone | 100.0 /100 | #7 | Exceptional 86.1% |
| Immigrants | Ethiopia | 100.0 /100 | #8 | Exceptional 85.9% |
| Ethiopians | 100.0 /100 | #9 | Exceptional 85.9% |
| Cape Verdeans | 100.0 /100 | #10 | Exceptional 85.8% |
| Immigrants | Cameroon | 100.0 /100 | #11 | Exceptional 85.8% |
| Liberians | 100.0 /100 | #12 | Exceptional 85.7% |
| Somalis | 100.0 /100 | #13 | Exceptional 85.6% |
| Immigrants | Somalia | 100.0 /100 | #14 | Exceptional 85.6% |
| Norwegians | 100.0 /100 | #15 | Exceptional 85.6% |
| Immigrants | Ireland | 100.0 /100 | #16 | Exceptional 85.6% |
| Immigrants | North Macedonia | 100.0 /100 | #17 | Exceptional 85.6% |
| Carpatho Rusyns | 100.0 /100 | #18 | Exceptional 85.6% |