Mongolian vs Immigrants from Southern Europe In Labor Force | Age 16-19
COMPARE
Mongolian
Immigrants from Southern Europe
In Labor Force | Age 16-19
In Labor Force | Age 16-19 Comparison
Mongolians
Immigrants from Southern Europe
35.3%
IN LABOR FORCE | AGE 16-19
5.7/ 100
METRIC RATING
227th/ 347
METRIC RANK
36.4%
IN LABOR FORCE | AGE 16-19
43.3/ 100
METRIC RATING
179th/ 347
METRIC RANK
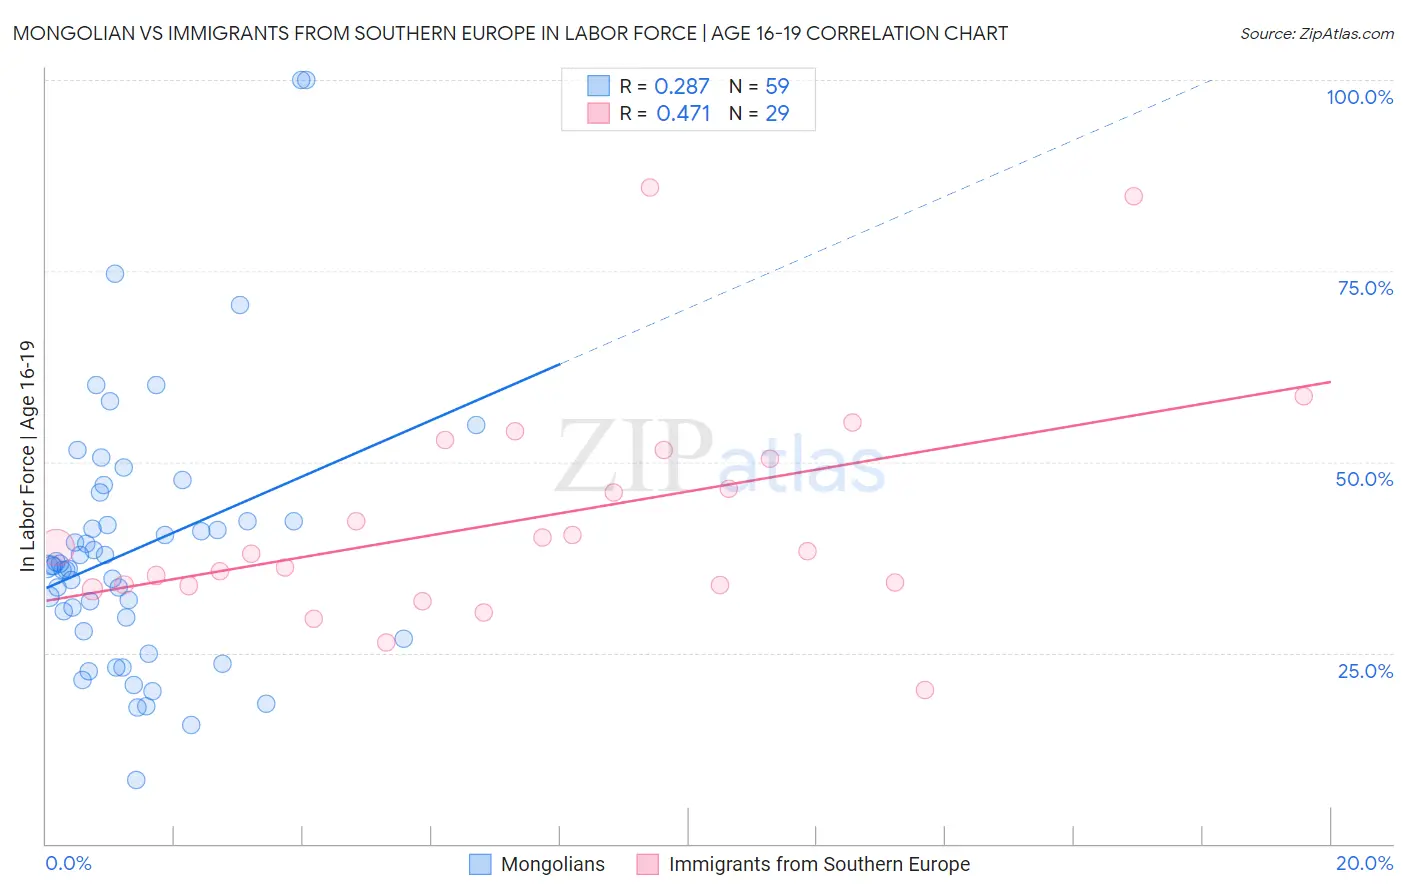
Mongolian vs Immigrants from Southern Europe In Labor Force | Age 16-19 Correlation Chart
The statistical analysis conducted on geographies consisting of 140,345,007 people shows a weak positive correlation between the proportion of Mongolians and labor force participation rate among population between the ages 16 and 19 in the United States with a correlation coefficient (R) of 0.287 and weighted average of 35.3%. Similarly, the statistical analysis conducted on geographies consisting of 401,923,668 people shows a moderate positive correlation between the proportion of Immigrants from Southern Europe and labor force participation rate among population between the ages 16 and 19 in the United States with a correlation coefficient (R) of 0.471 and weighted average of 36.4%, a difference of 3.3%.
In Labor Force | Age 16-19 Correlation Summary
| Measurement | Mongolian | Immigrants from Southern Europe |
| Minimum | 8.3% | 20.1% |
| Maximum | 100.0% | 85.9% |
| Range | 91.7% | 65.8% |
| Mean | 38.6% | 42.7% |
| Median | 36.4% | 38.4% |
| Interquartile 25% (IQ1) | 27.9% | 33.9% |
| Interquartile 75% (IQ3) | 42.3% | 51.0% |
| Interquartile Range (IQR) | 14.4% | 17.1% |
| Standard Deviation (Sample) | 17.5% | 15.0% |
| Standard Deviation (Population) | 17.3% | 14.7% |
Similar Demographics by In Labor Force | Age 16-19
Demographics Similar to Mongolians by In Labor Force | Age 16-19
In terms of in labor force | age 16-19, the demographic groups most similar to Mongolians are Immigrants from Guatemala (35.3%, a difference of 0.010%), Immigrants from Senegal (35.3%, a difference of 0.050%), Immigrants from Belgium (35.3%, a difference of 0.10%), Honduran (35.3%, a difference of 0.18%), and Immigrants from Lebanon (35.2%, a difference of 0.18%).
| Demographics | Rating | Rank | In Labor Force | Age 16-19 |
| Immigrants | Bahamas | 8.3 /100 | #220 | Tragic 35.5% |
| Turks | 7.3 /100 | #221 | Tragic 35.4% |
| Immigrants | Ghana | 7.3 /100 | #222 | Tragic 35.4% |
| Ghanaians | 6.5 /100 | #223 | Tragic 35.3% |
| Hondurans | 6.5 /100 | #224 | Tragic 35.3% |
| Immigrants | Belgium | 6.1 /100 | #225 | Tragic 35.3% |
| Immigrants | Guatemala | 5.7 /100 | #226 | Tragic 35.3% |
| Mongolians | 5.7 /100 | #227 | Tragic 35.3% |
| Immigrants | Senegal | 5.5 /100 | #228 | Tragic 35.3% |
| Immigrants | Lebanon | 5.0 /100 | #229 | Tragic 35.2% |
| Immigrants | Honduras | 4.9 /100 | #230 | Tragic 35.2% |
| Immigrants | Syria | 4.5 /100 | #231 | Tragic 35.2% |
| Immigrants | Kazakhstan | 4.5 /100 | #232 | Tragic 35.2% |
| Immigrants | France | 4.3 /100 | #233 | Tragic 35.1% |
| Immigrants | Mexico | 4.2 /100 | #234 | Tragic 35.1% |
Demographics Similar to Immigrants from Southern Europe by In Labor Force | Age 16-19
In terms of in labor force | age 16-19, the demographic groups most similar to Immigrants from Southern Europe are Black/African American (36.5%, a difference of 0.090%), Immigrants from Morocco (36.4%, a difference of 0.12%), Immigrants from Northern Europe (36.5%, a difference of 0.17%), Jordanian (36.4%, a difference of 0.20%), and Immigrants from Italy (36.4%, a difference of 0.22%).
| Demographics | Rating | Rank | In Labor Force | Age 16-19 |
| South Africans | 58.3 /100 | #172 | Average 36.7% |
| Russians | 57.5 /100 | #173 | Average 36.7% |
| Immigrants | Czechoslovakia | 50.0 /100 | #174 | Average 36.6% |
| Natives/Alaskans | 49.0 /100 | #175 | Average 36.6% |
| Albanians | 48.8 /100 | #176 | Average 36.5% |
| Immigrants | Northern Europe | 46.6 /100 | #177 | Average 36.5% |
| Blacks/African Americans | 45.1 /100 | #178 | Average 36.5% |
| Immigrants | Southern Europe | 43.3 /100 | #179 | Average 36.4% |
| Immigrants | Morocco | 41.1 /100 | #180 | Average 36.4% |
| Jordanians | 39.6 /100 | #181 | Fair 36.4% |
| Immigrants | Italy | 39.1 /100 | #182 | Fair 36.4% |
| Eastern Europeans | 38.8 /100 | #183 | Fair 36.4% |
| Costa Ricans | 36.1 /100 | #184 | Fair 36.3% |
| Bhutanese | 35.3 /100 | #185 | Fair 36.3% |
| Immigrants | Romania | 34.0 /100 | #186 | Fair 36.3% |