Immigrants from Netherlands vs Immigrants from Southern Europe In Labor Force | Age 16-19
COMPARE
Immigrants from Netherlands
Immigrants from Southern Europe
In Labor Force | Age 16-19
In Labor Force | Age 16-19 Comparison
Immigrants from Netherlands
Immigrants from Southern Europe
37.8%
IN LABOR FORCE | AGE 16-19
93.7/ 100
METRIC RATING
134th/ 347
METRIC RANK
36.4%
IN LABOR FORCE | AGE 16-19
43.3/ 100
METRIC RATING
179th/ 347
METRIC RANK
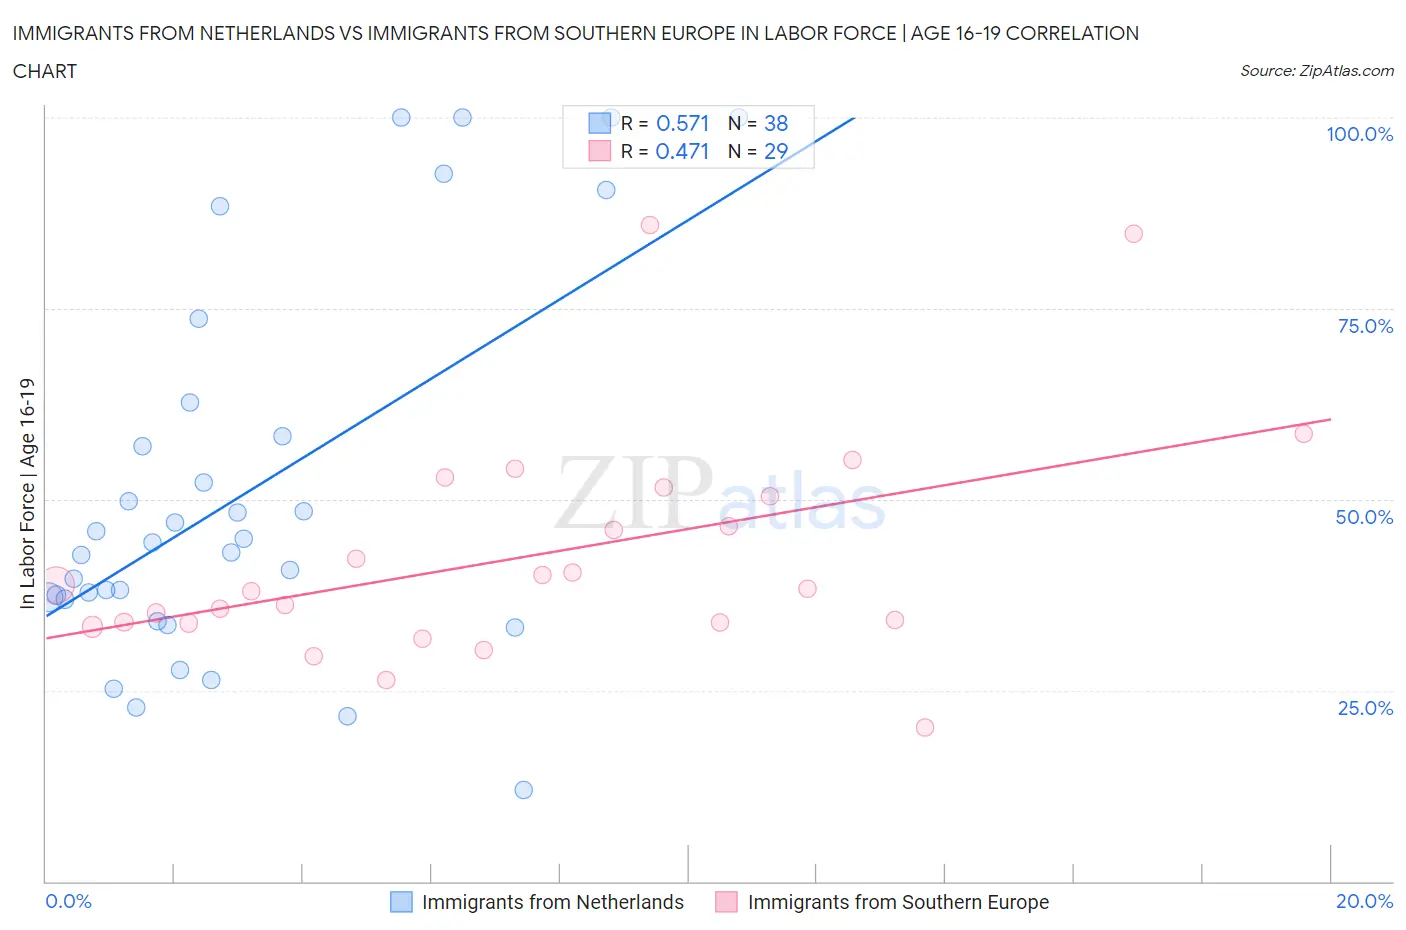
Immigrants from Netherlands vs Immigrants from Southern Europe In Labor Force | Age 16-19 Correlation Chart
The statistical analysis conducted on geographies consisting of 237,512,378 people shows a substantial positive correlation between the proportion of Immigrants from Netherlands and labor force participation rate among population between the ages 16 and 19 in the United States with a correlation coefficient (R) of 0.571 and weighted average of 37.8%. Similarly, the statistical analysis conducted on geographies consisting of 401,923,668 people shows a moderate positive correlation between the proportion of Immigrants from Southern Europe and labor force participation rate among population between the ages 16 and 19 in the United States with a correlation coefficient (R) of 0.471 and weighted average of 36.4%, a difference of 3.7%.
In Labor Force | Age 16-19 Correlation Summary
| Measurement | Immigrants from Netherlands | Immigrants from Southern Europe |
| Minimum | 12.0% | 20.1% |
| Maximum | 100.0% | 85.9% |
| Range | 88.0% | 65.8% |
| Mean | 50.8% | 42.7% |
| Median | 43.7% | 38.4% |
| Interquartile 25% (IQ1) | 36.9% | 33.9% |
| Interquartile 75% (IQ3) | 58.3% | 51.0% |
| Interquartile Range (IQR) | 21.4% | 17.1% |
| Standard Deviation (Sample) | 24.7% | 15.0% |
| Standard Deviation (Population) | 24.3% | 14.7% |
Similar Demographics by In Labor Force | Age 16-19
Demographics Similar to Immigrants from Netherlands by In Labor Force | Age 16-19
In terms of in labor force | age 16-19, the demographic groups most similar to Immigrants from Netherlands are Macedonian (37.8%, a difference of 0.060%), Australian (37.8%, a difference of 0.090%), Cajun (37.8%, a difference of 0.090%), Cheyenne (37.9%, a difference of 0.21%), and Immigrants from Oceania (37.9%, a difference of 0.23%).
| Demographics | Rating | Rank | In Labor Force | Age 16-19 |
| Choctaw | 95.6 /100 | #127 | Exceptional 38.0% |
| New Zealanders | 95.6 /100 | #128 | Exceptional 38.0% |
| Spaniards | 95.5 /100 | #129 | Exceptional 38.0% |
| Immigrants | Zimbabwe | 95.4 /100 | #130 | Exceptional 38.0% |
| Immigrants | Austria | 95.0 /100 | #131 | Exceptional 37.9% |
| Immigrants | Oceania | 94.7 /100 | #132 | Exceptional 37.9% |
| Cheyenne | 94.6 /100 | #133 | Exceptional 37.9% |
| Immigrants | Netherlands | 93.7 /100 | #134 | Exceptional 37.8% |
| Macedonians | 93.4 /100 | #135 | Exceptional 37.8% |
| Australians | 93.2 /100 | #136 | Exceptional 37.8% |
| Cajuns | 93.2 /100 | #137 | Exceptional 37.8% |
| Comanche | 91.9 /100 | #138 | Exceptional 37.7% |
| Immigrants | Moldova | 91.9 /100 | #139 | Exceptional 37.7% |
| Estonians | 91.7 /100 | #140 | Exceptional 37.7% |
| Syrians | 90.7 /100 | #141 | Exceptional 37.6% |
Demographics Similar to Immigrants from Southern Europe by In Labor Force | Age 16-19
In terms of in labor force | age 16-19, the demographic groups most similar to Immigrants from Southern Europe are Black/African American (36.5%, a difference of 0.090%), Immigrants from Morocco (36.4%, a difference of 0.12%), Immigrants from Northern Europe (36.5%, a difference of 0.17%), Jordanian (36.4%, a difference of 0.20%), and Immigrants from Italy (36.4%, a difference of 0.22%).
| Demographics | Rating | Rank | In Labor Force | Age 16-19 |
| South Africans | 58.3 /100 | #172 | Average 36.7% |
| Russians | 57.5 /100 | #173 | Average 36.7% |
| Immigrants | Czechoslovakia | 50.0 /100 | #174 | Average 36.6% |
| Natives/Alaskans | 49.0 /100 | #175 | Average 36.6% |
| Albanians | 48.8 /100 | #176 | Average 36.5% |
| Immigrants | Northern Europe | 46.6 /100 | #177 | Average 36.5% |
| Blacks/African Americans | 45.1 /100 | #178 | Average 36.5% |
| Immigrants | Southern Europe | 43.3 /100 | #179 | Average 36.4% |
| Immigrants | Morocco | 41.1 /100 | #180 | Average 36.4% |
| Jordanians | 39.6 /100 | #181 | Fair 36.4% |
| Immigrants | Italy | 39.1 /100 | #182 | Fair 36.4% |
| Eastern Europeans | 38.8 /100 | #183 | Fair 36.4% |
| Costa Ricans | 36.1 /100 | #184 | Fair 36.3% |
| Bhutanese | 35.3 /100 | #185 | Fair 36.3% |
| Immigrants | Romania | 34.0 /100 | #186 | Fair 36.3% |