Immigrants from Northern Europe vs Immigrants from Hong Kong In Labor Force | Age 35-44
COMPARE
Immigrants from Northern Europe
Immigrants from Hong Kong
In Labor Force | Age 35-44
In Labor Force | Age 35-44 Comparison
Immigrants from Northern Europe
Immigrants from Hong Kong
84.7%
IN LABOR FORCE | AGE 35-44
91.5/ 100
METRIC RATING
120th/ 347
METRIC RANK
85.2%
IN LABOR FORCE | AGE 35-44
99.8/ 100
METRIC RATING
46th/ 347
METRIC RANK
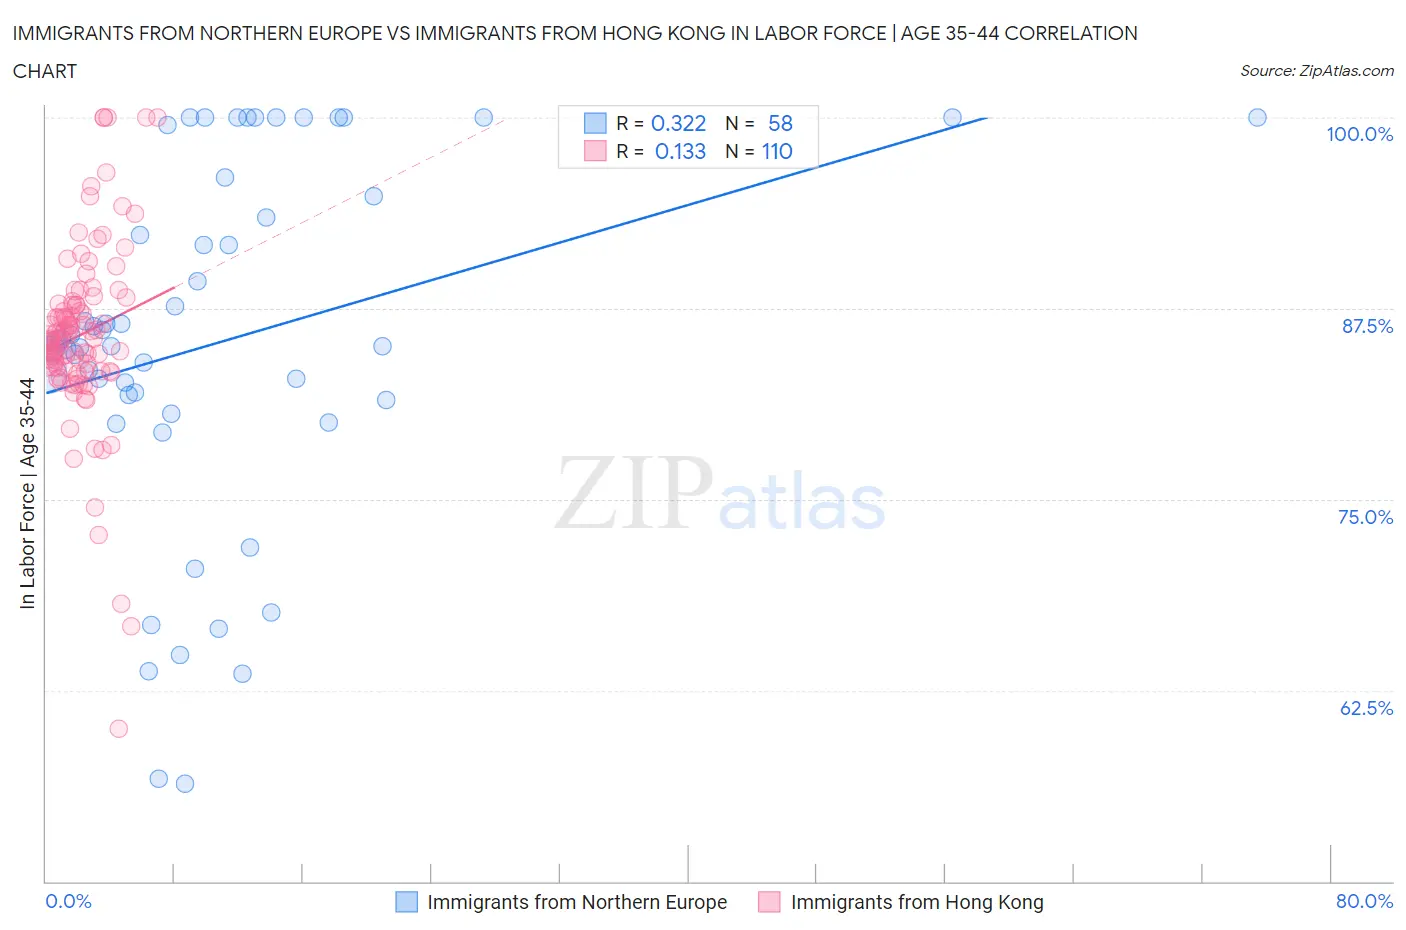
Immigrants from Northern Europe vs Immigrants from Hong Kong In Labor Force | Age 35-44 Correlation Chart
The statistical analysis conducted on geographies consisting of 476,925,244 people shows a mild positive correlation between the proportion of Immigrants from Northern Europe and labor force participation rate among population between the ages 35 and 44 in the United States with a correlation coefficient (R) of 0.322 and weighted average of 84.7%. Similarly, the statistical analysis conducted on geographies consisting of 253,913,732 people shows a poor positive correlation between the proportion of Immigrants from Hong Kong and labor force participation rate among population between the ages 35 and 44 in the United States with a correlation coefficient (R) of 0.133 and weighted average of 85.2%, a difference of 0.59%.
In Labor Force | Age 35-44 Correlation Summary
| Measurement | Immigrants from Northern Europe | Immigrants from Hong Kong |
| Minimum | 56.4% | 60.0% |
| Maximum | 100.0% | 100.0% |
| Range | 43.6% | 40.0% |
| Mean | 85.3% | 85.8% |
| Median | 85.2% | 85.5% |
| Interquartile 25% (IQ1) | 81.5% | 83.6% |
| Interquartile 75% (IQ3) | 94.8% | 87.7% |
| Interquartile Range (IQR) | 13.3% | 4.1% |
| Standard Deviation (Sample) | 11.7% | 6.0% |
| Standard Deviation (Population) | 11.6% | 6.0% |
Similar Demographics by In Labor Force | Age 35-44
Demographics Similar to Immigrants from Northern Europe by In Labor Force | Age 35-44
In terms of in labor force | age 35-44, the demographic groups most similar to Immigrants from Northern Europe are Burmese (84.7%, a difference of 0.0%), Immigrants from Eastern Asia (84.7%, a difference of 0.010%), Finnish (84.7%, a difference of 0.010%), German (84.7%, a difference of 0.010%), and Immigrants from South America (84.7%, a difference of 0.010%).
| Demographics | Rating | Rank | In Labor Force | Age 35-44 |
| Uruguayans | 93.3 /100 | #113 | Exceptional 84.7% |
| Chileans | 93.2 /100 | #114 | Exceptional 84.7% |
| Bahamians | 93.2 /100 | #115 | Exceptional 84.7% |
| Immigrants | Egypt | 92.7 /100 | #116 | Exceptional 84.7% |
| Immigrants | China | 92.3 /100 | #117 | Exceptional 84.7% |
| Immigrants | Eastern Asia | 92.1 /100 | #118 | Exceptional 84.7% |
| Burmese | 91.8 /100 | #119 | Exceptional 84.7% |
| Immigrants | Northern Europe | 91.5 /100 | #120 | Exceptional 84.7% |
| Finns | 91.2 /100 | #121 | Exceptional 84.7% |
| Germans | 91.0 /100 | #122 | Exceptional 84.7% |
| Immigrants | South America | 90.9 /100 | #123 | Exceptional 84.7% |
| Slavs | 90.8 /100 | #124 | Exceptional 84.7% |
| Maltese | 90.8 /100 | #125 | Exceptional 84.7% |
| Asians | 90.6 /100 | #126 | Exceptional 84.7% |
| Immigrants | Spain | 90.6 /100 | #127 | Exceptional 84.7% |
Demographics Similar to Immigrants from Hong Kong by In Labor Force | Age 35-44
In terms of in labor force | age 35-44, the demographic groups most similar to Immigrants from Hong Kong are Cypriot (85.2%, a difference of 0.0%), German Russian (85.2%, a difference of 0.010%), Polish (85.2%, a difference of 0.020%), Lithuanian (85.2%, a difference of 0.020%), and Immigrants from Eritrea (85.2%, a difference of 0.020%).
| Demographics | Rating | Rank | In Labor Force | Age 35-44 |
| Eastern Europeans | 99.8 /100 | #39 | Exceptional 85.2% |
| Immigrants | Bulgaria | 99.8 /100 | #40 | Exceptional 85.2% |
| Immigrants | Zimbabwe | 99.8 /100 | #41 | Exceptional 85.2% |
| Macedonians | 99.8 /100 | #42 | Exceptional 85.2% |
| Poles | 99.8 /100 | #43 | Exceptional 85.2% |
| Lithuanians | 99.8 /100 | #44 | Exceptional 85.2% |
| Cypriots | 99.8 /100 | #45 | Exceptional 85.2% |
| Immigrants | Hong Kong | 99.8 /100 | #46 | Exceptional 85.2% |
| German Russians | 99.8 /100 | #47 | Exceptional 85.2% |
| Immigrants | Eritrea | 99.7 /100 | #48 | Exceptional 85.2% |
| Croatians | 99.7 /100 | #49 | Exceptional 85.2% |
| Thais | 99.7 /100 | #50 | Exceptional 85.2% |
| Immigrants | Albania | 99.7 /100 | #51 | Exceptional 85.1% |
| Immigrants | Kenya | 99.6 /100 | #52 | Exceptional 85.1% |
| Taiwanese | 99.6 /100 | #53 | Exceptional 85.1% |