Mexican vs Immigrants from Norway In Labor Force | Age 35-44
COMPARE
Mexican
Immigrants from Norway
In Labor Force | Age 35-44
In Labor Force | Age 35-44 Comparison
Mexicans
Immigrants from Norway
81.6%
IN LABOR FORCE | AGE 35-44
0.0/ 100
METRIC RATING
313th/ 347
METRIC RANK
84.1%
IN LABOR FORCE | AGE 35-44
11.7/ 100
METRIC RATING
217th/ 347
METRIC RANK
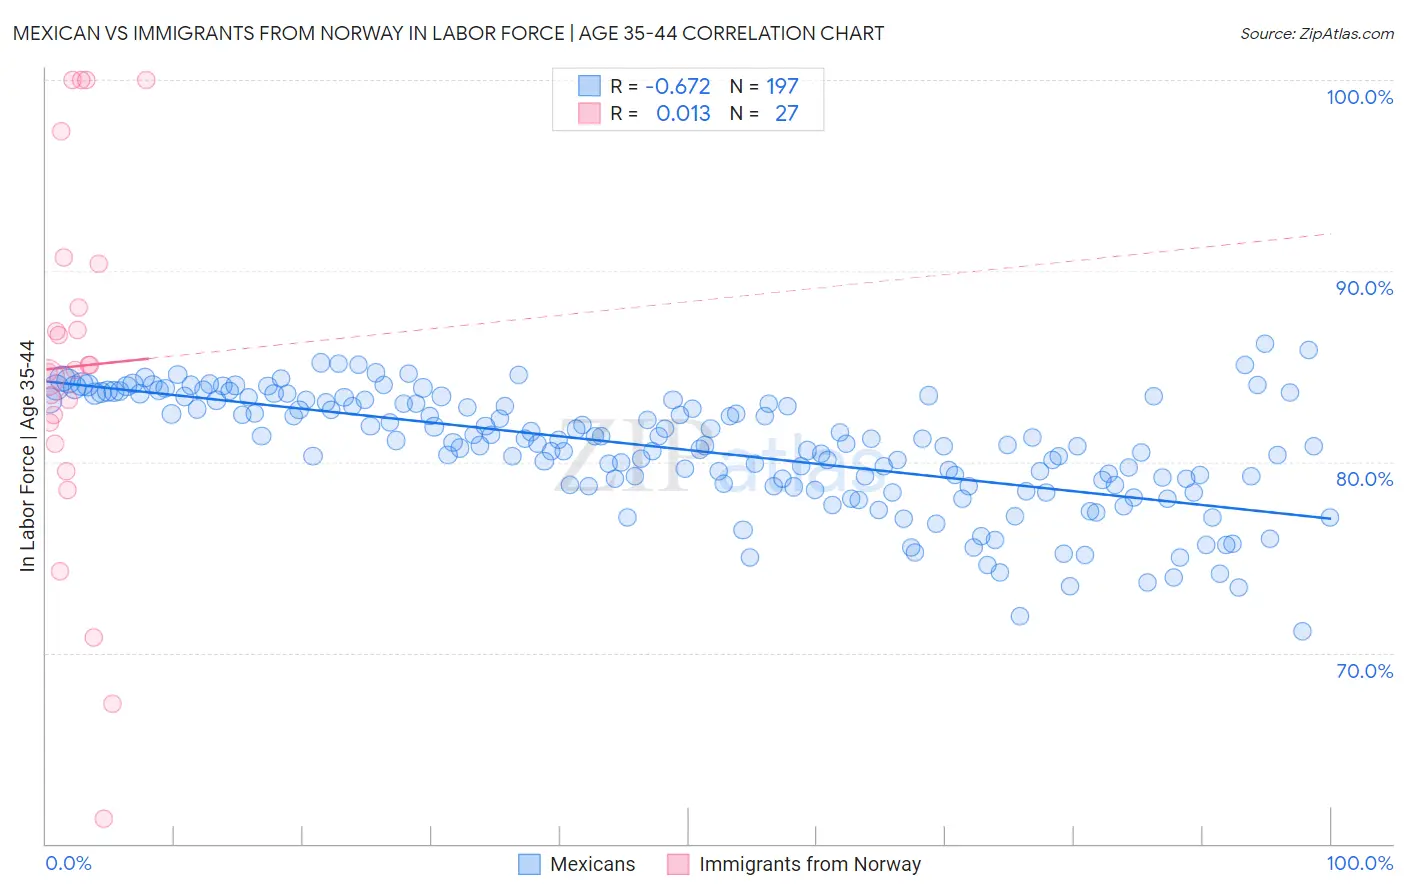
Mexican vs Immigrants from Norway In Labor Force | Age 35-44 Correlation Chart
The statistical analysis conducted on geographies consisting of 564,555,689 people shows a significant negative correlation between the proportion of Mexicans and labor force participation rate among population between the ages 35 and 44 in the United States with a correlation coefficient (R) of -0.672 and weighted average of 81.6%. Similarly, the statistical analysis conducted on geographies consisting of 116,704,105 people shows no correlation between the proportion of Immigrants from Norway and labor force participation rate among population between the ages 35 and 44 in the United States with a correlation coefficient (R) of 0.013 and weighted average of 84.1%, a difference of 3.0%.
In Labor Force | Age 35-44 Correlation Summary
| Measurement | Mexican | Immigrants from Norway |
| Minimum | 71.1% | 61.3% |
| Maximum | 86.2% | 100.0% |
| Range | 15.0% | 38.7% |
| Mean | 80.7% | 85.0% |
| Median | 81.0% | 84.8% |
| Interquartile 25% (IQ1) | 78.8% | 80.9% |
| Interquartile 75% (IQ3) | 83.3% | 90.4% |
| Interquartile Range (IQR) | 4.5% | 9.5% |
| Standard Deviation (Sample) | 3.1% | 9.7% |
| Standard Deviation (Population) | 3.0% | 9.5% |
Similar Demographics by In Labor Force | Age 35-44
Demographics Similar to Mexicans by In Labor Force | Age 35-44
In terms of in labor force | age 35-44, the demographic groups most similar to Mexicans are Alaska Native (81.6%, a difference of 0.0%), Cajun (81.5%, a difference of 0.11%), Immigrants from Mexico (81.5%, a difference of 0.14%), Colville (81.7%, a difference of 0.15%), and Comanche (81.5%, a difference of 0.16%).
| Demographics | Rating | Rank | In Labor Force | Age 35-44 |
| Blacks/African Americans | 0.0 /100 | #306 | Tragic 82.2% |
| Hispanics or Latinos | 0.0 /100 | #307 | Tragic 82.1% |
| Immigrants | Central America | 0.0 /100 | #308 | Tragic 82.0% |
| Cree | 0.0 /100 | #309 | Tragic 82.0% |
| Blackfeet | 0.0 /100 | #310 | Tragic 81.9% |
| Colville | 0.0 /100 | #311 | Tragic 81.7% |
| Alaska Natives | 0.0 /100 | #312 | Tragic 81.6% |
| Mexicans | 0.0 /100 | #313 | Tragic 81.6% |
| Cajuns | 0.0 /100 | #314 | Tragic 81.5% |
| Immigrants | Mexico | 0.0 /100 | #315 | Tragic 81.5% |
| Comanche | 0.0 /100 | #316 | Tragic 81.5% |
| Cherokee | 0.0 /100 | #317 | Tragic 81.4% |
| Alaskan Athabascans | 0.0 /100 | #318 | Tragic 81.3% |
| Inupiat | 0.0 /100 | #319 | Tragic 80.9% |
| Chickasaw | 0.0 /100 | #320 | Tragic 80.9% |
Demographics Similar to Immigrants from Norway by In Labor Force | Age 35-44
In terms of in labor force | age 35-44, the demographic groups most similar to Immigrants from Norway are European (84.1%, a difference of 0.010%), Nicaraguan (84.1%, a difference of 0.010%), Immigrants from Barbados (84.1%, a difference of 0.020%), Israeli (84.1%, a difference of 0.030%), and Bangladeshi (84.1%, a difference of 0.030%).
| Demographics | Rating | Rank | In Labor Force | Age 35-44 |
| New Zealanders | 16.2 /100 | #210 | Poor 84.1% |
| Immigrants | Ecuador | 15.2 /100 | #211 | Poor 84.1% |
| Israelis | 14.0 /100 | #212 | Poor 84.1% |
| Bangladeshis | 13.7 /100 | #213 | Poor 84.1% |
| Immigrants | Barbados | 13.2 /100 | #214 | Poor 84.1% |
| Europeans | 12.2 /100 | #215 | Poor 84.1% |
| Nicaraguans | 12.1 /100 | #216 | Poor 84.1% |
| Immigrants | Norway | 11.7 /100 | #217 | Poor 84.1% |
| Immigrants | Nicaragua | 9.4 /100 | #218 | Tragic 84.1% |
| Sub-Saharan Africans | 9.3 /100 | #219 | Tragic 84.1% |
| French | 7.5 /100 | #220 | Tragic 84.0% |
| Icelanders | 6.7 /100 | #221 | Tragic 84.0% |
| Assyrians/Chaldeans/Syriacs | 6.6 /100 | #222 | Tragic 84.0% |
| Immigrants | Panama | 6.4 /100 | #223 | Tragic 84.0% |
| U.S. Virgin Islanders | 6.1 /100 | #224 | Tragic 84.0% |