Menominee vs Immigrants from South Central Asia In Labor Force | Age 45-54
COMPARE
Menominee
Immigrants from South Central Asia
In Labor Force | Age 45-54
In Labor Force | Age 45-54 Comparison
Menominee
Immigrants from South Central Asia
77.4%
IN LABOR FORCE | AGE 45-54
0.0/ 100
METRIC RATING
332nd/ 347
METRIC RANK
84.0%
IN LABOR FORCE | AGE 45-54
99.9/ 100
METRIC RATING
18th/ 347
METRIC RANK
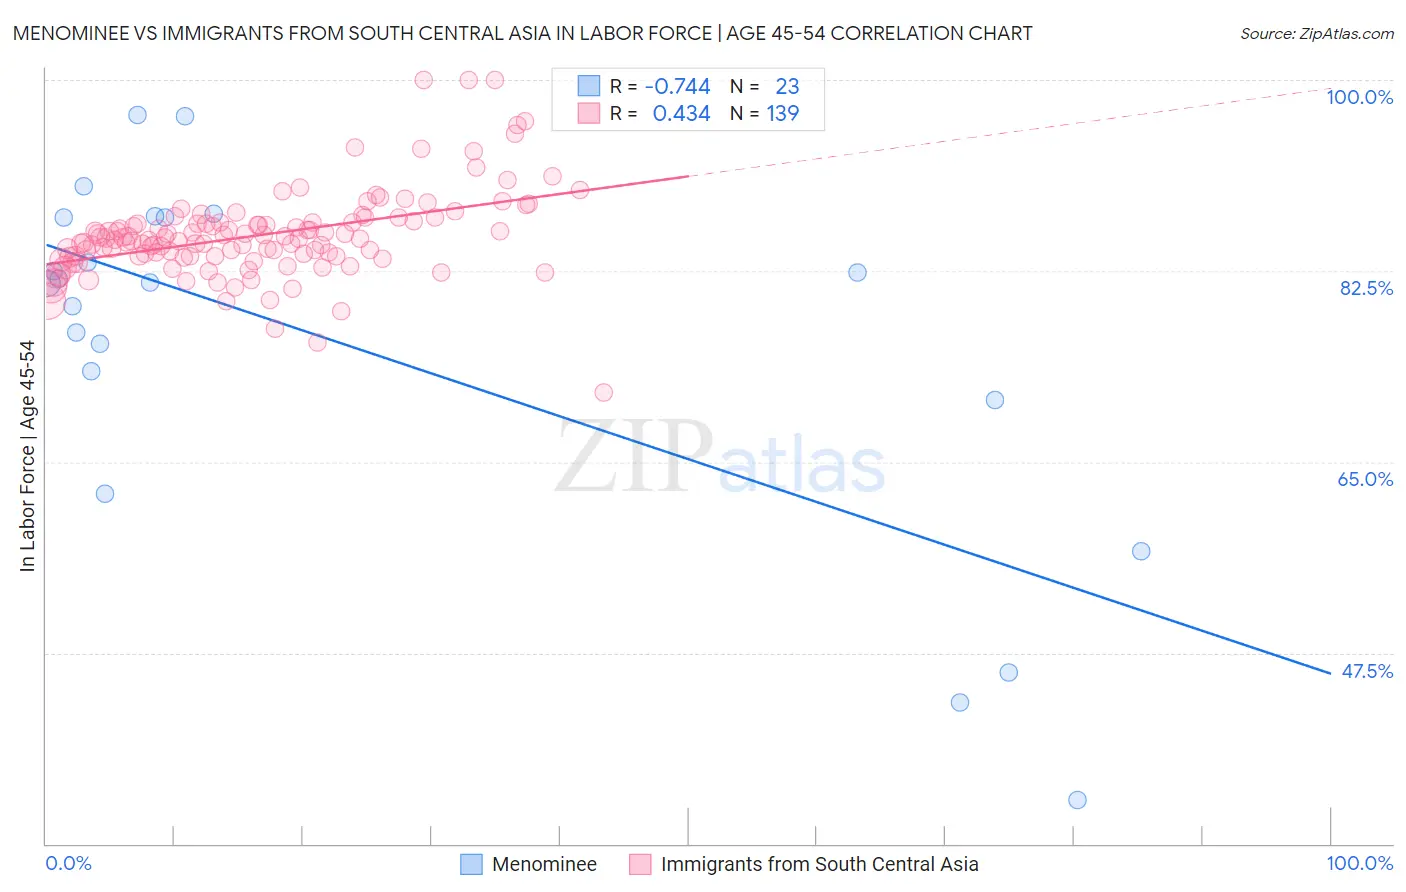
Menominee vs Immigrants from South Central Asia In Labor Force | Age 45-54 Correlation Chart
The statistical analysis conducted on geographies consisting of 45,777,282 people shows a strong negative correlation between the proportion of Menominee and labor force participation rate among population between the ages 45 and 54 in the United States with a correlation coefficient (R) of -0.744 and weighted average of 77.4%. Similarly, the statistical analysis conducted on geographies consisting of 472,630,186 people shows a moderate positive correlation between the proportion of Immigrants from South Central Asia and labor force participation rate among population between the ages 45 and 54 in the United States with a correlation coefficient (R) of 0.434 and weighted average of 84.0%, a difference of 8.5%.
In Labor Force | Age 45-54 Correlation Summary
| Measurement | Menominee | Immigrants from South Central Asia |
| Minimum | 34.0% | 71.4% |
| Maximum | 96.8% | 100.0% |
| Range | 62.8% | 28.6% |
| Mean | 75.8% | 85.8% |
| Median | 81.4% | 85.5% |
| Interquartile 25% (IQ1) | 70.7% | 83.9% |
| Interquartile 75% (IQ3) | 87.4% | 87.0% |
| Interquartile Range (IQR) | 16.7% | 3.1% |
| Standard Deviation (Sample) | 16.8% | 4.1% |
| Standard Deviation (Population) | 16.4% | 4.0% |
Similar Demographics by In Labor Force | Age 45-54
Demographics Similar to Menominee by In Labor Force | Age 45-54
In terms of in labor force | age 45-54, the demographic groups most similar to Menominee are Tsimshian (77.4%, a difference of 0.030%), Cheyenne (77.6%, a difference of 0.18%), Native/Alaskan (77.1%, a difference of 0.36%), Apache (77.1%, a difference of 0.36%), and Creek (77.7%, a difference of 0.41%).
| Demographics | Rating | Rank | In Labor Force | Age 45-54 |
| Choctaw | 0.0 /100 | #325 | Tragic 78.2% |
| Seminole | 0.0 /100 | #326 | Tragic 78.1% |
| Cajuns | 0.0 /100 | #327 | Tragic 78.1% |
| Sioux | 0.0 /100 | #328 | Tragic 78.0% |
| Creek | 0.0 /100 | #329 | Tragic 77.7% |
| Cheyenne | 0.0 /100 | #330 | Tragic 77.6% |
| Tsimshian | 0.0 /100 | #331 | Tragic 77.4% |
| Menominee | 0.0 /100 | #332 | Tragic 77.4% |
| Natives/Alaskans | 0.0 /100 | #333 | Tragic 77.1% |
| Apache | 0.0 /100 | #334 | Tragic 77.1% |
| Arapaho | 0.0 /100 | #335 | Tragic 77.1% |
| Paiute | 0.0 /100 | #336 | Tragic 76.7% |
| Ute | 0.0 /100 | #337 | Tragic 76.6% |
| Yuman | 0.0 /100 | #338 | Tragic 76.3% |
| Puerto Ricans | 0.0 /100 | #339 | Tragic 75.9% |
Demographics Similar to Immigrants from South Central Asia by In Labor Force | Age 45-54
In terms of in labor force | age 45-54, the demographic groups most similar to Immigrants from South Central Asia are Zimbabwean (84.0%, a difference of 0.0%), Immigrants from Nepal (84.0%, a difference of 0.030%), Cypriot (84.1%, a difference of 0.040%), Cambodian (84.1%, a difference of 0.10%), and Czech (83.9%, a difference of 0.11%).
| Demographics | Rating | Rank | In Labor Force | Age 45-54 |
| Thais | 100.0 /100 | #11 | Exceptional 84.3% |
| Bulgarians | 100.0 /100 | #12 | Exceptional 84.2% |
| Chinese | 99.9 /100 | #13 | Exceptional 84.1% |
| Cambodians | 99.9 /100 | #14 | Exceptional 84.1% |
| Cypriots | 99.9 /100 | #15 | Exceptional 84.1% |
| Immigrants | Nepal | 99.9 /100 | #16 | Exceptional 84.0% |
| Zimbabweans | 99.9 /100 | #17 | Exceptional 84.0% |
| Immigrants | South Central Asia | 99.9 /100 | #18 | Exceptional 84.0% |
| Czechs | 99.8 /100 | #19 | Exceptional 83.9% |
| Immigrants | Eastern Africa | 99.8 /100 | #20 | Exceptional 83.9% |
| Immigrants | Sri Lanka | 99.8 /100 | #21 | Exceptional 83.9% |
| Immigrants | Ireland | 99.8 /100 | #22 | Exceptional 83.9% |
| Tlingit-Haida | 99.8 /100 | #23 | Exceptional 83.9% |
| Slovenes | 99.8 /100 | #24 | Exceptional 83.9% |
| Immigrants | North Macedonia | 99.8 /100 | #25 | Exceptional 83.9% |