Menominee vs Immigrants from Poland In Labor Force | Age 45-54
COMPARE
Menominee
Immigrants from Poland
In Labor Force | Age 45-54
In Labor Force | Age 45-54 Comparison
Menominee
Immigrants from Poland
77.4%
IN LABOR FORCE | AGE 45-54
0.0/ 100
METRIC RATING
332nd/ 347
METRIC RANK
83.6%
IN LABOR FORCE | AGE 45-54
99.0/ 100
METRIC RATING
48th/ 347
METRIC RANK
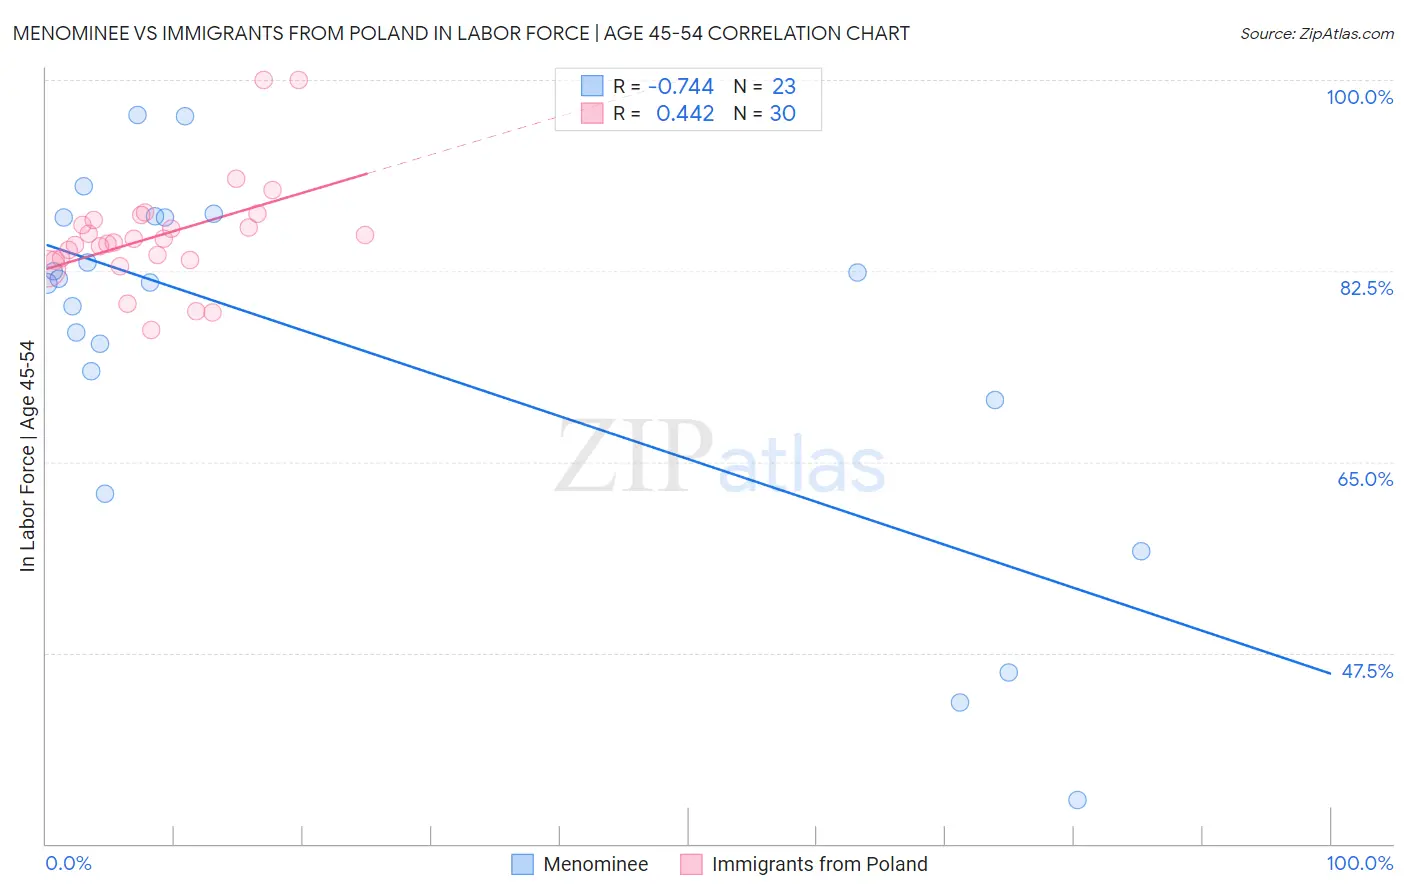
Menominee vs Immigrants from Poland In Labor Force | Age 45-54 Correlation Chart
The statistical analysis conducted on geographies consisting of 45,777,282 people shows a strong negative correlation between the proportion of Menominee and labor force participation rate among population between the ages 45 and 54 in the United States with a correlation coefficient (R) of -0.744 and weighted average of 77.4%. Similarly, the statistical analysis conducted on geographies consisting of 304,786,786 people shows a moderate positive correlation between the proportion of Immigrants from Poland and labor force participation rate among population between the ages 45 and 54 in the United States with a correlation coefficient (R) of 0.442 and weighted average of 83.6%, a difference of 8.0%.
In Labor Force | Age 45-54 Correlation Summary
| Measurement | Menominee | Immigrants from Poland |
| Minimum | 34.0% | 77.1% |
| Maximum | 96.8% | 100.0% |
| Range | 62.8% | 22.9% |
| Mean | 75.8% | 85.7% |
| Median | 81.4% | 85.3% |
| Interquartile 25% (IQ1) | 70.7% | 83.5% |
| Interquartile 75% (IQ3) | 87.4% | 87.2% |
| Interquartile Range (IQR) | 16.7% | 3.6% |
| Standard Deviation (Sample) | 16.8% | 5.0% |
| Standard Deviation (Population) | 16.4% | 4.9% |
Similar Demographics by In Labor Force | Age 45-54
Demographics Similar to Menominee by In Labor Force | Age 45-54
In terms of in labor force | age 45-54, the demographic groups most similar to Menominee are Tsimshian (77.4%, a difference of 0.030%), Cheyenne (77.6%, a difference of 0.18%), Native/Alaskan (77.1%, a difference of 0.36%), Apache (77.1%, a difference of 0.36%), and Creek (77.7%, a difference of 0.41%).
| Demographics | Rating | Rank | In Labor Force | Age 45-54 |
| Choctaw | 0.0 /100 | #325 | Tragic 78.2% |
| Seminole | 0.0 /100 | #326 | Tragic 78.1% |
| Cajuns | 0.0 /100 | #327 | Tragic 78.1% |
| Sioux | 0.0 /100 | #328 | Tragic 78.0% |
| Creek | 0.0 /100 | #329 | Tragic 77.7% |
| Cheyenne | 0.0 /100 | #330 | Tragic 77.6% |
| Tsimshian | 0.0 /100 | #331 | Tragic 77.4% |
| Menominee | 0.0 /100 | #332 | Tragic 77.4% |
| Natives/Alaskans | 0.0 /100 | #333 | Tragic 77.1% |
| Apache | 0.0 /100 | #334 | Tragic 77.1% |
| Arapaho | 0.0 /100 | #335 | Tragic 77.1% |
| Paiute | 0.0 /100 | #336 | Tragic 76.7% |
| Ute | 0.0 /100 | #337 | Tragic 76.6% |
| Yuman | 0.0 /100 | #338 | Tragic 76.3% |
| Puerto Ricans | 0.0 /100 | #339 | Tragic 75.9% |
Demographics Similar to Immigrants from Poland by In Labor Force | Age 45-54
In terms of in labor force | age 45-54, the demographic groups most similar to Immigrants from Poland are Immigrants from Morocco (83.6%, a difference of 0.0%), Croatian (83.6%, a difference of 0.010%), Lithuanian (83.6%, a difference of 0.020%), Burmese (83.6%, a difference of 0.030%), and Immigrants from Hong Kong (83.6%, a difference of 0.030%).
| Demographics | Rating | Rank | In Labor Force | Age 45-54 |
| Immigrants | Korea | 99.3 /100 | #41 | Exceptional 83.7% |
| Immigrants | Moldova | 99.3 /100 | #42 | Exceptional 83.7% |
| Venezuelans | 99.2 /100 | #43 | Exceptional 83.6% |
| Burmese | 99.1 /100 | #44 | Exceptional 83.6% |
| Immigrants | Hong Kong | 99.1 /100 | #45 | Exceptional 83.6% |
| Lithuanians | 99.1 /100 | #46 | Exceptional 83.6% |
| Croatians | 99.0 /100 | #47 | Exceptional 83.6% |
| Immigrants | Poland | 99.0 /100 | #48 | Exceptional 83.6% |
| Immigrants | Morocco | 99.0 /100 | #49 | Exceptional 83.6% |
| Immigrants | Greece | 98.8 /100 | #50 | Exceptional 83.6% |
| Immigrants | Turkey | 98.8 /100 | #51 | Exceptional 83.6% |
| Poles | 98.7 /100 | #52 | Exceptional 83.6% |
| Peruvians | 98.7 /100 | #53 | Exceptional 83.6% |
| Somalis | 98.7 /100 | #54 | Exceptional 83.5% |
| Macedonians | 98.7 /100 | #55 | Exceptional 83.5% |