Menominee vs Osage In Labor Force | Age 45-54
COMPARE
Menominee
Osage
In Labor Force | Age 45-54
In Labor Force | Age 45-54 Comparison
Menominee
Osage
77.4%
IN LABOR FORCE | AGE 45-54
0.0/ 100
METRIC RATING
332nd/ 347
METRIC RANK
80.6%
IN LABOR FORCE | AGE 45-54
0.0/ 100
METRIC RATING
293rd/ 347
METRIC RANK
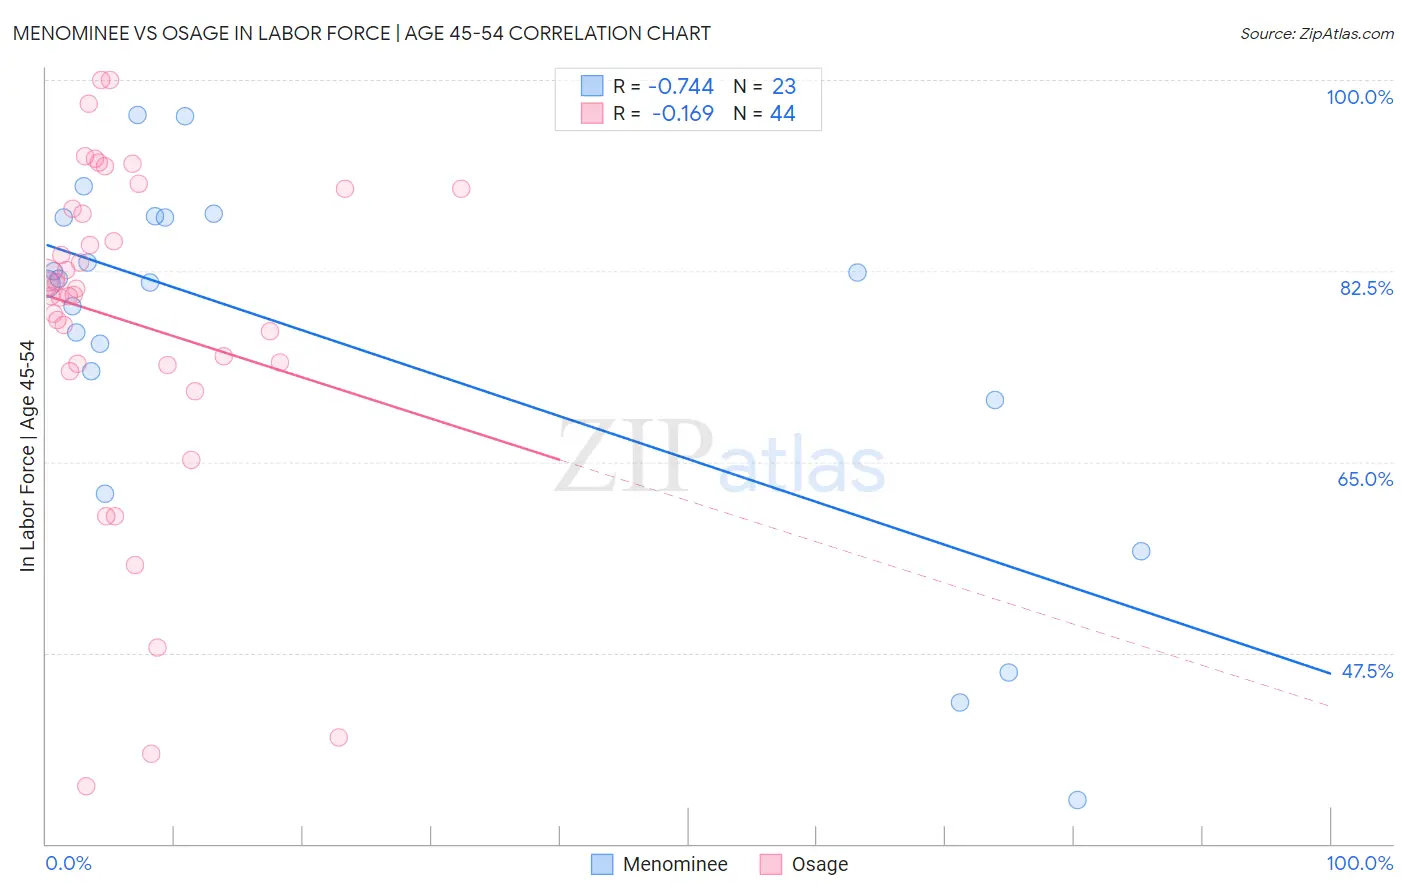
Menominee vs Osage In Labor Force | Age 45-54 Correlation Chart
The statistical analysis conducted on geographies consisting of 45,777,282 people shows a strong negative correlation between the proportion of Menominee and labor force participation rate among population between the ages 45 and 54 in the United States with a correlation coefficient (R) of -0.744 and weighted average of 77.4%. Similarly, the statistical analysis conducted on geographies consisting of 91,796,641 people shows a poor negative correlation between the proportion of Osage and labor force participation rate among population between the ages 45 and 54 in the United States with a correlation coefficient (R) of -0.169 and weighted average of 80.6%, a difference of 4.1%.
In Labor Force | Age 45-54 Correlation Summary
| Measurement | Menominee | Osage |
| Minimum | 34.0% | 35.3% |
| Maximum | 96.8% | 100.0% |
| Range | 62.8% | 64.7% |
| Mean | 75.8% | 77.9% |
| Median | 81.4% | 80.6% |
| Interquartile 25% (IQ1) | 70.7% | 74.0% |
| Interquartile 75% (IQ3) | 87.4% | 89.1% |
| Interquartile Range (IQR) | 16.7% | 15.1% |
| Standard Deviation (Sample) | 16.8% | 15.6% |
| Standard Deviation (Population) | 16.4% | 15.5% |
Similar Demographics by In Labor Force | Age 45-54
Demographics Similar to Menominee by In Labor Force | Age 45-54
In terms of in labor force | age 45-54, the demographic groups most similar to Menominee are Tsimshian (77.4%, a difference of 0.030%), Cheyenne (77.6%, a difference of 0.18%), Native/Alaskan (77.1%, a difference of 0.36%), Apache (77.1%, a difference of 0.36%), and Creek (77.7%, a difference of 0.41%).
| Demographics | Rating | Rank | In Labor Force | Age 45-54 |
| Choctaw | 0.0 /100 | #325 | Tragic 78.2% |
| Seminole | 0.0 /100 | #326 | Tragic 78.1% |
| Cajuns | 0.0 /100 | #327 | Tragic 78.1% |
| Sioux | 0.0 /100 | #328 | Tragic 78.0% |
| Creek | 0.0 /100 | #329 | Tragic 77.7% |
| Cheyenne | 0.0 /100 | #330 | Tragic 77.6% |
| Tsimshian | 0.0 /100 | #331 | Tragic 77.4% |
| Menominee | 0.0 /100 | #332 | Tragic 77.4% |
| Natives/Alaskans | 0.0 /100 | #333 | Tragic 77.1% |
| Apache | 0.0 /100 | #334 | Tragic 77.1% |
| Arapaho | 0.0 /100 | #335 | Tragic 77.1% |
| Paiute | 0.0 /100 | #336 | Tragic 76.7% |
| Ute | 0.0 /100 | #337 | Tragic 76.6% |
| Yuman | 0.0 /100 | #338 | Tragic 76.3% |
| Puerto Ricans | 0.0 /100 | #339 | Tragic 75.9% |
Demographics Similar to Osage by In Labor Force | Age 45-54
In terms of in labor force | age 45-54, the demographic groups most similar to Osage are Yakama (80.6%, a difference of 0.0%), Iroquois (80.6%, a difference of 0.020%), Immigrants from Belize (80.6%, a difference of 0.050%), Nepalese (80.5%, a difference of 0.070%), and African (80.5%, a difference of 0.10%).
| Demographics | Rating | Rank | In Labor Force | Age 45-54 |
| Immigrants | Dominica | 0.0 /100 | #286 | Tragic 80.8% |
| Vietnamese | 0.0 /100 | #287 | Tragic 80.8% |
| Cree | 0.0 /100 | #288 | Tragic 80.8% |
| Immigrants | Bangladesh | 0.0 /100 | #289 | Tragic 80.7% |
| Mexican American Indians | 0.0 /100 | #290 | Tragic 80.7% |
| Immigrants | Belize | 0.0 /100 | #291 | Tragic 80.6% |
| Iroquois | 0.0 /100 | #292 | Tragic 80.6% |
| Osage | 0.0 /100 | #293 | Tragic 80.6% |
| Yakama | 0.0 /100 | #294 | Tragic 80.6% |
| Nepalese | 0.0 /100 | #295 | Tragic 80.5% |
| Africans | 0.0 /100 | #296 | Tragic 80.5% |
| Americans | 0.0 /100 | #297 | Tragic 80.4% |
| Marshallese | 0.0 /100 | #298 | Tragic 80.3% |
| Dominicans | 0.0 /100 | #299 | Tragic 80.3% |
| Fijians | 0.0 /100 | #300 | Tragic 80.2% |