Afghan vs South American Indian In Labor Force | Age 25-29
COMPARE
Afghan
South American Indian
In Labor Force | Age 25-29
In Labor Force | Age 25-29 Comparison
Afghans
South American Indians
84.4%
IN LABOR FORCE | AGE 25-29
15.9/ 100
METRIC RATING
202nd/ 347
METRIC RANK
84.5%
IN LABOR FORCE | AGE 25-29
25.0/ 100
METRIC RATING
193rd/ 347
METRIC RANK
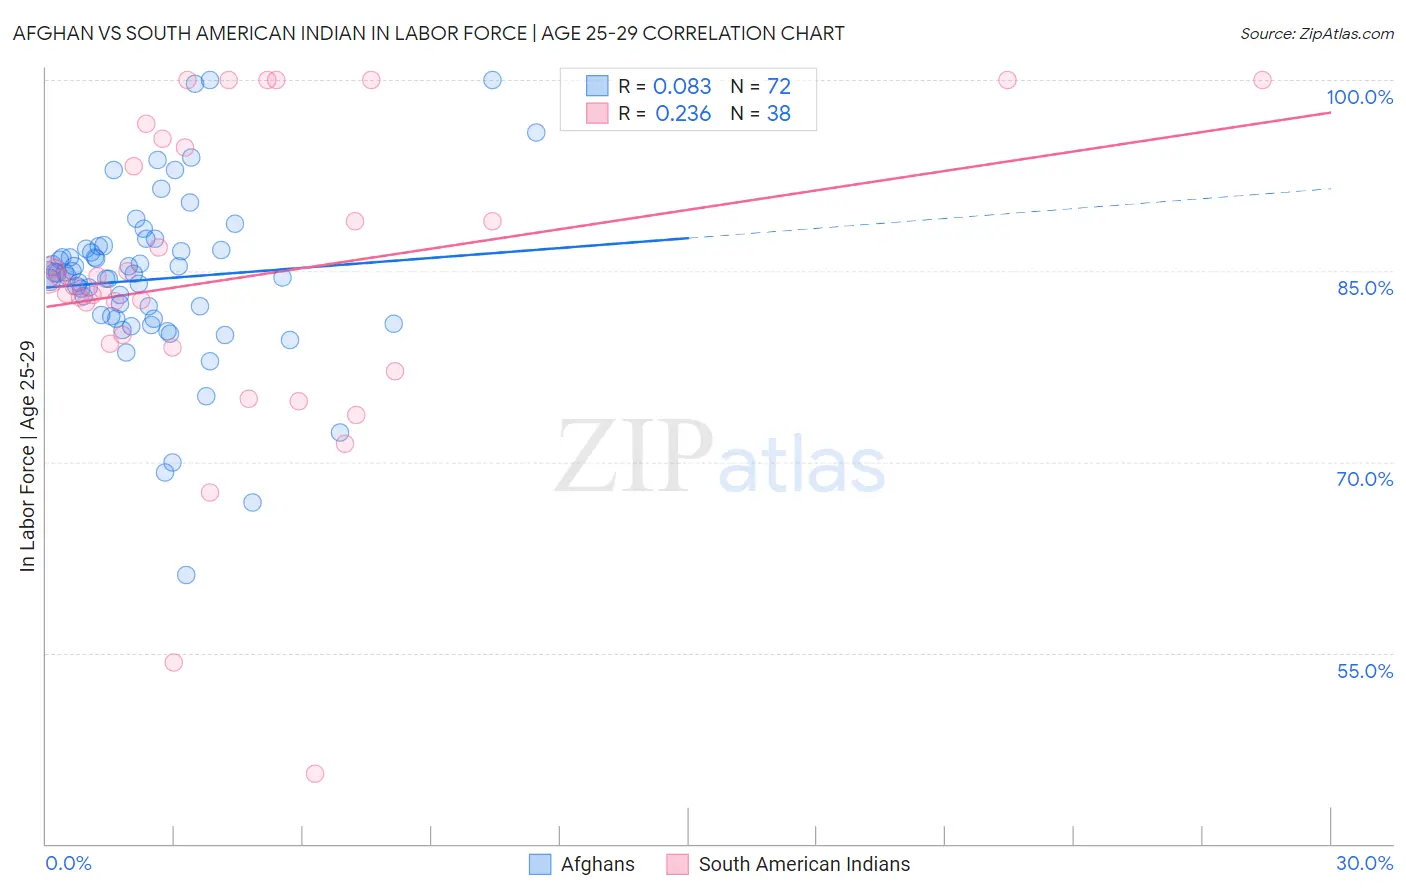
Afghan vs South American Indian In Labor Force | Age 25-29 Correlation Chart
The statistical analysis conducted on geographies consisting of 148,868,617 people shows a slight positive correlation between the proportion of Afghans and labor force participation rate among population between the ages 25 and 29 in the United States with a correlation coefficient (R) of 0.083 and weighted average of 84.4%. Similarly, the statistical analysis conducted on geographies consisting of 164,547,486 people shows a weak positive correlation between the proportion of South American Indians and labor force participation rate among population between the ages 25 and 29 in the United States with a correlation coefficient (R) of 0.236 and weighted average of 84.5%, a difference of 0.11%.
In Labor Force | Age 25-29 Correlation Summary
| Measurement | Afghan | South American Indian |
| Minimum | 61.1% | 45.5% |
| Maximum | 100.0% | 100.0% |
| Range | 38.9% | 54.5% |
| Mean | 84.3% | 84.5% |
| Median | 84.7% | 84.1% |
| Interquartile 25% (IQ1) | 81.3% | 79.3% |
| Interquartile 75% (IQ3) | 86.7% | 94.7% |
| Interquartile Range (IQR) | 5.4% | 15.4% |
| Standard Deviation (Sample) | 6.7% | 12.2% |
| Standard Deviation (Population) | 6.6% | 12.0% |
Demographics Similar to Afghans and South American Indians by In Labor Force | Age 25-29
In terms of in labor force | age 25-29, the demographic groups most similar to Afghans are Immigrants from Afghanistan (84.4%, a difference of 0.0%), Laotian (84.4%, a difference of 0.010%), Venezuelan (84.4%, a difference of 0.010%), Immigrants from Kazakhstan (84.4%, a difference of 0.020%), and Ecuadorian (84.4%, a difference of 0.020%). Similarly, the demographic groups most similar to South American Indians are English (84.5%, a difference of 0.010%), Zimbabwean (84.5%, a difference of 0.030%), Portuguese (84.4%, a difference of 0.040%), Immigrants from Israel (84.4%, a difference of 0.040%), and Welsh (84.5%, a difference of 0.060%).
| Demographics | Rating | Rank | In Labor Force | Age 25-29 |
| Immigrants | Portugal | 34.7 /100 | #187 | Fair 84.6% |
| Immigrants | Ukraine | 33.7 /100 | #188 | Fair 84.5% |
| Moroccans | 32.6 /100 | #189 | Fair 84.5% |
| Welsh | 31.1 /100 | #190 | Fair 84.5% |
| Zimbabweans | 28.7 /100 | #191 | Fair 84.5% |
| English | 25.8 /100 | #192 | Fair 84.5% |
| South American Indians | 25.0 /100 | #193 | Fair 84.5% |
| Portuguese | 21.2 /100 | #194 | Fair 84.4% |
| Immigrants | Israel | 20.8 /100 | #195 | Fair 84.4% |
| Immigrants | South Eastern Asia | 19.5 /100 | #196 | Poor 84.4% |
| Tlingit-Haida | 19.3 /100 | #197 | Poor 84.4% |
| Immigrants | Iraq | 19.0 /100 | #198 | Poor 84.4% |
| Immigrants | Germany | 18.3 /100 | #199 | Poor 84.4% |
| Immigrants | Kazakhstan | 17.5 /100 | #200 | Poor 84.4% |
| Laotians | 16.6 /100 | #201 | Poor 84.4% |
| Afghans | 15.9 /100 | #202 | Poor 84.4% |
| Immigrants | Afghanistan | 15.6 /100 | #203 | Poor 84.4% |
| Venezuelans | 15.1 /100 | #204 | Poor 84.4% |
| Ecuadorians | 14.8 /100 | #205 | Poor 84.4% |
| Immigrants | Cambodia | 14.3 /100 | #206 | Poor 84.4% |
| Immigrants | Armenia | 13.3 /100 | #207 | Poor 84.4% |