Marshallese vs Guatemalan In Labor Force | Age 25-29
COMPARE
Marshallese
Guatemalan
In Labor Force | Age 25-29
In Labor Force | Age 25-29 Comparison
Marshallese
Guatemalans
83.3%
IN LABOR FORCE | AGE 25-29
0.0/ 100
METRIC RATING
274th/ 347
METRIC RANK
83.7%
IN LABOR FORCE | AGE 25-29
0.2/ 100
METRIC RATING
252nd/ 347
METRIC RANK
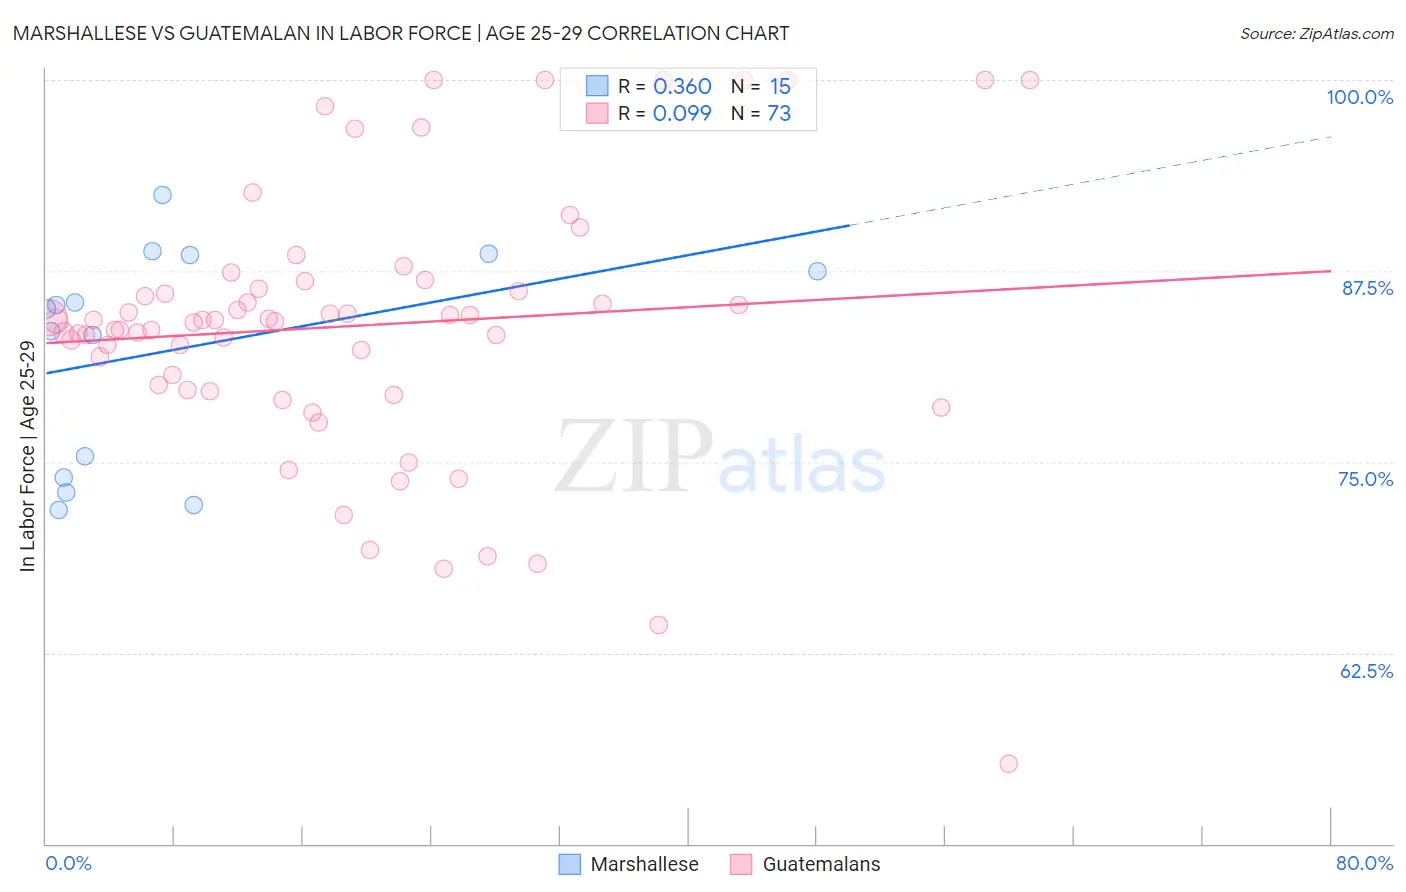
Marshallese vs Guatemalan In Labor Force | Age 25-29 Correlation Chart
The statistical analysis conducted on geographies consisting of 14,760,991 people shows a mild positive correlation between the proportion of Marshallese and labor force participation rate among population between the ages 25 and 29 in the United States with a correlation coefficient (R) of 0.360 and weighted average of 83.3%. Similarly, the statistical analysis conducted on geographies consisting of 409,424,907 people shows a slight positive correlation between the proportion of Guatemalans and labor force participation rate among population between the ages 25 and 29 in the United States with a correlation coefficient (R) of 0.099 and weighted average of 83.7%, a difference of 0.42%.
In Labor Force | Age 25-29 Correlation Summary
| Measurement | Marshallese | Guatemalan |
| Minimum | 71.9% | 55.2% |
| Maximum | 92.5% | 100.0% |
| Range | 20.6% | 44.8% |
| Mean | 82.3% | 83.9% |
| Median | 85.0% | 84.2% |
| Interquartile 25% (IQ1) | 74.0% | 79.9% |
| Interquartile 75% (IQ3) | 88.6% | 86.5% |
| Interquartile Range (IQR) | 14.6% | 6.7% |
| Standard Deviation (Sample) | 7.0% | 8.8% |
| Standard Deviation (Population) | 6.8% | 8.7% |
Similar Demographics by In Labor Force | Age 25-29
Demographics Similar to Marshallese by In Labor Force | Age 25-29
In terms of in labor force | age 25-29, the demographic groups most similar to Marshallese are Immigrants from Caribbean (83.4%, a difference of 0.030%), Immigrants from Dominica (83.4%, a difference of 0.030%), Samoan (83.3%, a difference of 0.050%), Immigrants from Honduras (83.3%, a difference of 0.050%), and Honduran (83.4%, a difference of 0.060%).
| Demographics | Rating | Rank | In Labor Force | Age 25-29 |
| Spanish Americans | 0.0 /100 | #267 | Tragic 83.4% |
| Immigrants | Lebanon | 0.0 /100 | #268 | Tragic 83.4% |
| Immigrants | Barbados | 0.0 /100 | #269 | Tragic 83.4% |
| Basques | 0.0 /100 | #270 | Tragic 83.4% |
| Hondurans | 0.0 /100 | #271 | Tragic 83.4% |
| Immigrants | Caribbean | 0.0 /100 | #272 | Tragic 83.4% |
| Immigrants | Dominica | 0.0 /100 | #273 | Tragic 83.4% |
| Marshallese | 0.0 /100 | #274 | Tragic 83.3% |
| Samoans | 0.0 /100 | #275 | Tragic 83.3% |
| Immigrants | Honduras | 0.0 /100 | #276 | Tragic 83.3% |
| Africans | 0.0 /100 | #277 | Tragic 83.2% |
| Immigrants | Cuba | 0.0 /100 | #278 | Tragic 83.2% |
| British West Indians | 0.0 /100 | #279 | Tragic 83.2% |
| Dominicans | 0.0 /100 | #280 | Tragic 83.2% |
| Immigrants | Dominican Republic | 0.0 /100 | #281 | Tragic 83.1% |
Demographics Similar to Guatemalans by In Labor Force | Age 25-29
In terms of in labor force | age 25-29, the demographic groups most similar to Guatemalans are Immigrants from Trinidad and Tobago (83.7%, a difference of 0.0%), Spaniard (83.7%, a difference of 0.0%), Bahamian (83.7%, a difference of 0.010%), Central American (83.7%, a difference of 0.020%), and Haitian (83.7%, a difference of 0.020%).
| Demographics | Rating | Rank | In Labor Force | Age 25-29 |
| Iroquois | 0.4 /100 | #245 | Tragic 83.8% |
| Cree | 0.3 /100 | #246 | Tragic 83.8% |
| Immigrants | El Salvador | 0.3 /100 | #247 | Tragic 83.7% |
| Immigrants | Nonimmigrants | 0.3 /100 | #248 | Tragic 83.7% |
| Hmong | 0.3 /100 | #249 | Tragic 83.7% |
| Central Americans | 0.2 /100 | #250 | Tragic 83.7% |
| Bahamians | 0.2 /100 | #251 | Tragic 83.7% |
| Guatemalans | 0.2 /100 | #252 | Tragic 83.7% |
| Immigrants | Trinidad and Tobago | 0.2 /100 | #253 | Tragic 83.7% |
| Spaniards | 0.2 /100 | #254 | Tragic 83.7% |
| Haitians | 0.2 /100 | #255 | Tragic 83.7% |
| Immigrants | Haiti | 0.2 /100 | #256 | Tragic 83.7% |
| Delaware | 0.2 /100 | #257 | Tragic 83.7% |
| Immigrants | Guatemala | 0.1 /100 | #258 | Tragic 83.6% |
| Spanish | 0.1 /100 | #259 | Tragic 83.6% |