Maltese vs Immigrants from Costa Rica In Labor Force | Age 16-19
COMPARE
Maltese
Immigrants from Costa Rica
In Labor Force | Age 16-19
In Labor Force | Age 16-19 Comparison
Maltese
Immigrants from Costa Rica
38.5%
IN LABOR FORCE | AGE 16-19
98.6/ 100
METRIC RATING
110th/ 347
METRIC RANK
35.6%
IN LABOR FORCE | AGE 16-19
10.7/ 100
METRIC RATING
217th/ 347
METRIC RANK
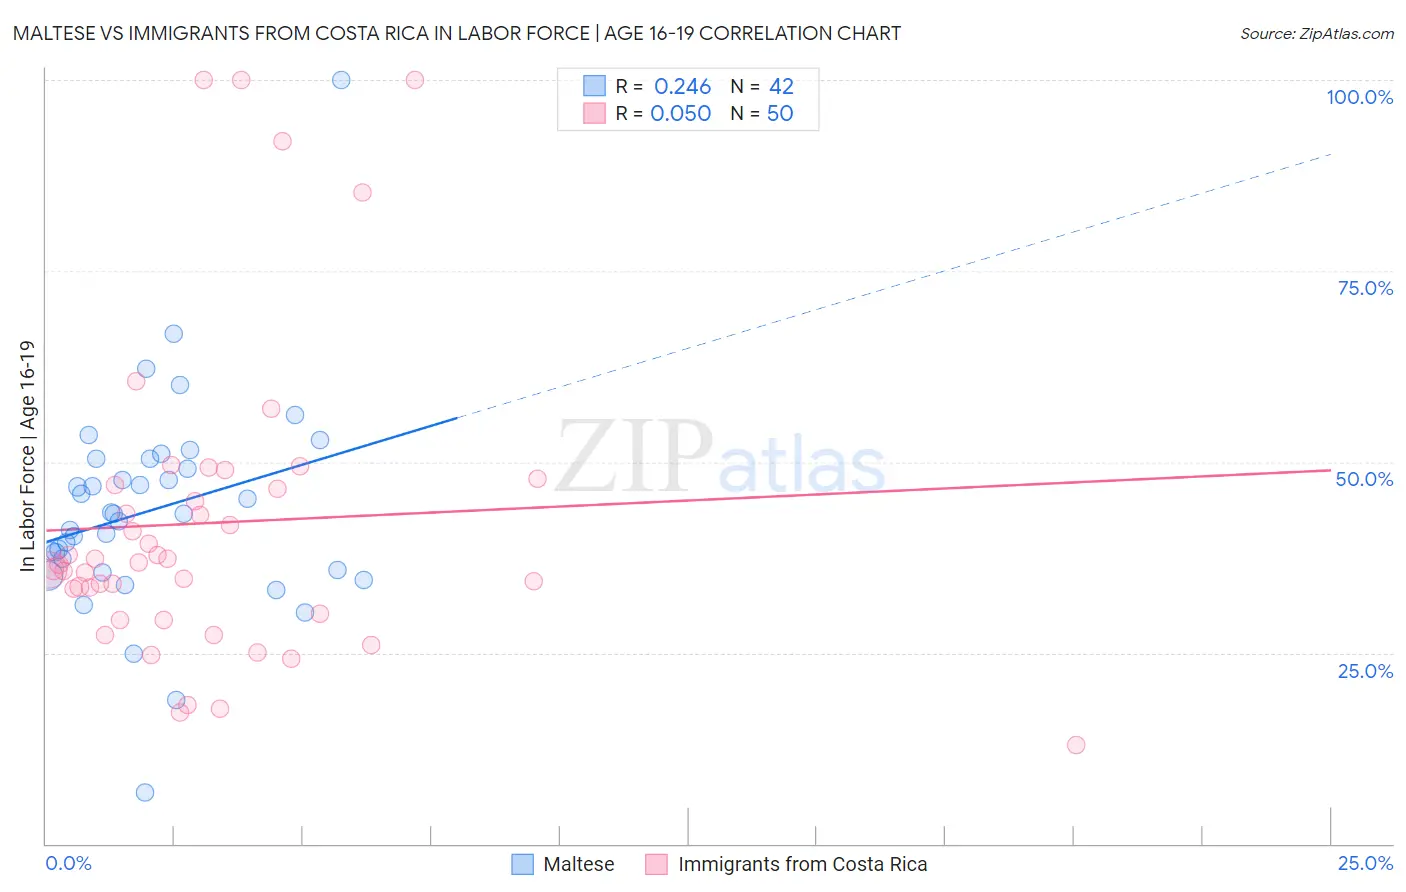
Maltese vs Immigrants from Costa Rica In Labor Force | Age 16-19 Correlation Chart
The statistical analysis conducted on geographies consisting of 126,398,157 people shows a weak positive correlation between the proportion of Maltese and labor force participation rate among population between the ages 16 and 19 in the United States with a correlation coefficient (R) of 0.246 and weighted average of 38.5%. Similarly, the statistical analysis conducted on geographies consisting of 204,218,033 people shows a slight positive correlation between the proportion of Immigrants from Costa Rica and labor force participation rate among population between the ages 16 and 19 in the United States with a correlation coefficient (R) of 0.050 and weighted average of 35.6%, a difference of 8.2%.
In Labor Force | Age 16-19 Correlation Summary
| Measurement | Maltese | Immigrants from Costa Rica |
| Minimum | 6.7% | 13.0% |
| Maximum | 100.0% | 100.0% |
| Range | 93.3% | 87.0% |
| Mean | 43.7% | 42.0% |
| Median | 43.2% | 36.7% |
| Interquartile 25% (IQ1) | 35.9% | 30.1% |
| Interquartile 75% (IQ3) | 50.4% | 46.9% |
| Interquartile Range (IQR) | 14.5% | 16.9% |
| Standard Deviation (Sample) | 14.2% | 20.6% |
| Standard Deviation (Population) | 14.1% | 20.4% |
Similar Demographics by In Labor Force | Age 16-19
Demographics Similar to Maltese by In Labor Force | Age 16-19
In terms of in labor force | age 16-19, the demographic groups most similar to Maltese are Crow (38.5%, a difference of 0.060%), Immigrants from Scotland (38.5%, a difference of 0.070%), Immigrants from Ethiopia (38.6%, a difference of 0.12%), Lebanese (38.6%, a difference of 0.12%), and Subsaharan African (38.4%, a difference of 0.20%).
| Demographics | Rating | Rank | In Labor Force | Age 16-19 |
| Immigrants | Cameroon | 99.0 /100 | #103 | Exceptional 38.7% |
| Immigrants | Eritrea | 99.0 /100 | #104 | Exceptional 38.7% |
| Iraqis | 98.9 /100 | #105 | Exceptional 38.6% |
| Delaware | 98.8 /100 | #106 | Exceptional 38.6% |
| Chinese | 98.8 /100 | #107 | Exceptional 38.6% |
| Immigrants | Ethiopia | 98.7 /100 | #108 | Exceptional 38.6% |
| Lebanese | 98.7 /100 | #109 | Exceptional 38.6% |
| Maltese | 98.6 /100 | #110 | Exceptional 38.5% |
| Crow | 98.5 /100 | #111 | Exceptional 38.5% |
| Immigrants | Scotland | 98.5 /100 | #112 | Exceptional 38.5% |
| Sub-Saharan Africans | 98.3 /100 | #113 | Exceptional 38.4% |
| Hawaiians | 98.2 /100 | #114 | Exceptional 38.4% |
| Bulgarians | 97.9 /100 | #115 | Exceptional 38.3% |
| Colville | 97.9 /100 | #116 | Exceptional 38.3% |
| Chickasaw | 97.8 /100 | #117 | Exceptional 38.3% |
Demographics Similar to Immigrants from Costa Rica by In Labor Force | Age 16-19
In terms of in labor force | age 16-19, the demographic groups most similar to Immigrants from Costa Rica are Dutch West Indian (35.6%, a difference of 0.0%), Immigrants from South Eastern Asia (35.6%, a difference of 0.020%), Apache (35.6%, a difference of 0.040%), Houma (35.6%, a difference of 0.050%), and Immigrants from Bolivia (35.6%, a difference of 0.050%).
| Demographics | Rating | Rank | In Labor Force | Age 16-19 |
| Immigrants | Switzerland | 11.9 /100 | #210 | Poor 35.6% |
| Mexicans | 11.9 /100 | #211 | Poor 35.6% |
| Houma | 11.0 /100 | #212 | Poor 35.6% |
| Immigrants | Bolivia | 11.0 /100 | #213 | Poor 35.6% |
| Apache | 11.0 /100 | #214 | Poor 35.6% |
| Immigrants | South Eastern Asia | 10.8 /100 | #215 | Poor 35.6% |
| Dutch West Indians | 10.7 /100 | #216 | Poor 35.6% |
| Immigrants | Costa Rica | 10.7 /100 | #217 | Poor 35.6% |
| Sri Lankans | 9.8 /100 | #218 | Tragic 35.5% |
| Guatemalans | 8.6 /100 | #219 | Tragic 35.5% |
| Immigrants | Bahamas | 8.3 /100 | #220 | Tragic 35.5% |
| Turks | 7.3 /100 | #221 | Tragic 35.4% |
| Immigrants | Ghana | 7.3 /100 | #222 | Tragic 35.4% |
| Ghanaians | 6.5 /100 | #223 | Tragic 35.3% |
| Hondurans | 6.5 /100 | #224 | Tragic 35.3% |