Maltese vs Spanish American Indian In Labor Force | Age 16-19
COMPARE
Maltese
Spanish American Indian
In Labor Force | Age 16-19
In Labor Force | Age 16-19 Comparison
Maltese
Spanish American Indians
38.5%
IN LABOR FORCE | AGE 16-19
98.6/ 100
METRIC RATING
110th/ 347
METRIC RANK
32.4%
IN LABOR FORCE | AGE 16-19
0.0/ 100
METRIC RATING
306th/ 347
METRIC RANK
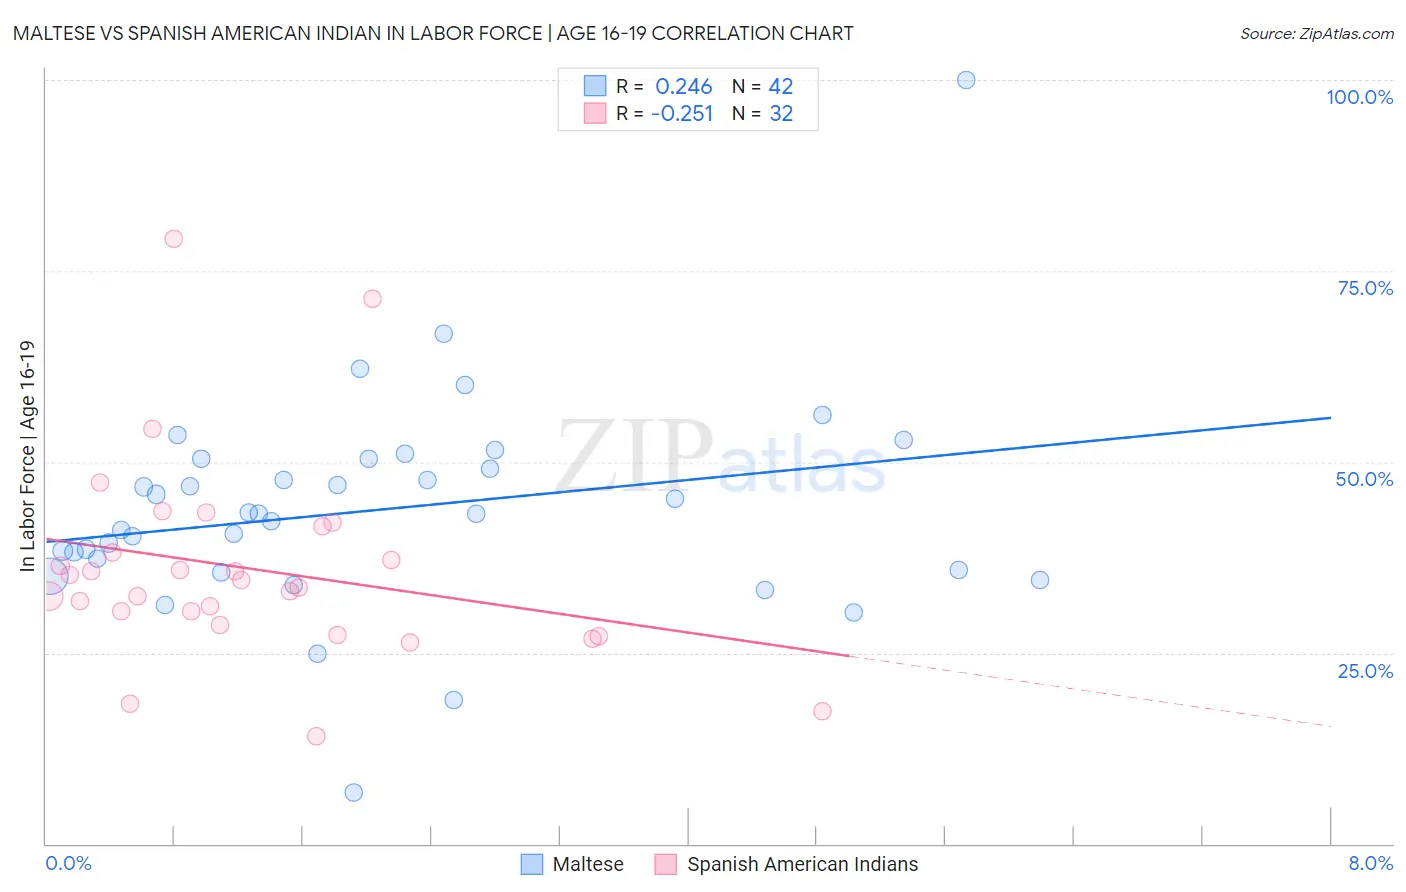
Maltese vs Spanish American Indian In Labor Force | Age 16-19 Correlation Chart
The statistical analysis conducted on geographies consisting of 126,398,157 people shows a weak positive correlation between the proportion of Maltese and labor force participation rate among population between the ages 16 and 19 in the United States with a correlation coefficient (R) of 0.246 and weighted average of 38.5%. Similarly, the statistical analysis conducted on geographies consisting of 73,134,655 people shows a weak negative correlation between the proportion of Spanish American Indians and labor force participation rate among population between the ages 16 and 19 in the United States with a correlation coefficient (R) of -0.251 and weighted average of 32.4%, a difference of 19.1%.
In Labor Force | Age 16-19 Correlation Summary
| Measurement | Maltese | Spanish American Indian |
| Minimum | 6.7% | 14.1% |
| Maximum | 100.0% | 79.2% |
| Range | 93.3% | 65.1% |
| Mean | 43.7% | 36.0% |
| Median | 43.2% | 34.0% |
| Interquartile 25% (IQ1) | 35.9% | 29.6% |
| Interquartile 75% (IQ3) | 50.4% | 39.9% |
| Interquartile Range (IQR) | 14.5% | 10.3% |
| Standard Deviation (Sample) | 14.2% | 13.2% |
| Standard Deviation (Population) | 14.1% | 13.0% |
Similar Demographics by In Labor Force | Age 16-19
Demographics Similar to Maltese by In Labor Force | Age 16-19
In terms of in labor force | age 16-19, the demographic groups most similar to Maltese are Crow (38.5%, a difference of 0.060%), Immigrants from Scotland (38.5%, a difference of 0.070%), Immigrants from Ethiopia (38.6%, a difference of 0.12%), Lebanese (38.6%, a difference of 0.12%), and Subsaharan African (38.4%, a difference of 0.20%).
| Demographics | Rating | Rank | In Labor Force | Age 16-19 |
| Immigrants | Cameroon | 99.0 /100 | #103 | Exceptional 38.7% |
| Immigrants | Eritrea | 99.0 /100 | #104 | Exceptional 38.7% |
| Iraqis | 98.9 /100 | #105 | Exceptional 38.6% |
| Delaware | 98.8 /100 | #106 | Exceptional 38.6% |
| Chinese | 98.8 /100 | #107 | Exceptional 38.6% |
| Immigrants | Ethiopia | 98.7 /100 | #108 | Exceptional 38.6% |
| Lebanese | 98.7 /100 | #109 | Exceptional 38.6% |
| Maltese | 98.6 /100 | #110 | Exceptional 38.5% |
| Crow | 98.5 /100 | #111 | Exceptional 38.5% |
| Immigrants | Scotland | 98.5 /100 | #112 | Exceptional 38.5% |
| Sub-Saharan Africans | 98.3 /100 | #113 | Exceptional 38.4% |
| Hawaiians | 98.2 /100 | #114 | Exceptional 38.4% |
| Bulgarians | 97.9 /100 | #115 | Exceptional 38.3% |
| Colville | 97.9 /100 | #116 | Exceptional 38.3% |
| Chickasaw | 97.8 /100 | #117 | Exceptional 38.3% |
Demographics Similar to Spanish American Indians by In Labor Force | Age 16-19
In terms of in labor force | age 16-19, the demographic groups most similar to Spanish American Indians are Nicaraguan (32.4%, a difference of 0.13%), Israeli (32.4%, a difference of 0.18%), Immigrants from Dominica (32.5%, a difference of 0.37%), Immigrants from Jamaica (32.2%, a difference of 0.49%), and Navajo (32.1%, a difference of 0.84%).
| Demographics | Rating | Rank | In Labor Force | Age 16-19 |
| Armenians | 0.0 /100 | #299 | Tragic 32.9% |
| Immigrants | Argentina | 0.0 /100 | #300 | Tragic 32.9% |
| Okinawans | 0.0 /100 | #301 | Tragic 32.8% |
| Belizeans | 0.0 /100 | #302 | Tragic 32.8% |
| Immigrants | Dominica | 0.0 /100 | #303 | Tragic 32.5% |
| Israelis | 0.0 /100 | #304 | Tragic 32.4% |
| Nicaraguans | 0.0 /100 | #305 | Tragic 32.4% |
| Spanish American Indians | 0.0 /100 | #306 | Tragic 32.4% |
| Immigrants | Jamaica | 0.0 /100 | #307 | Tragic 32.2% |
| Navajo | 0.0 /100 | #308 | Tragic 32.1% |
| Immigrants | Eastern Asia | 0.0 /100 | #309 | Tragic 32.0% |
| Immigrants | Iran | 0.0 /100 | #310 | Tragic 32.0% |
| Indians (Asian) | 0.0 /100 | #311 | Tragic 31.9% |
| Immigrants | Belize | 0.0 /100 | #312 | Tragic 31.8% |
| Hopi | 0.0 /100 | #313 | Tragic 31.8% |